

Mapping, Geography, Earth Sciences
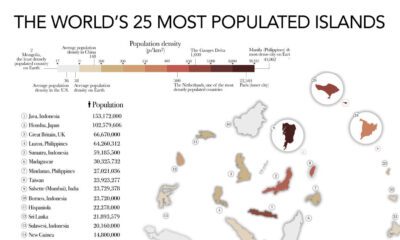

The most populated islands of the earth are teeming hubs of human activity, a far cry from the remote paradises in popular imaginations.
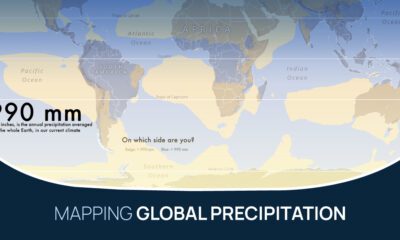

What does the global precipitation map look like if we split it in two, one half with below average rainfall and the other above?
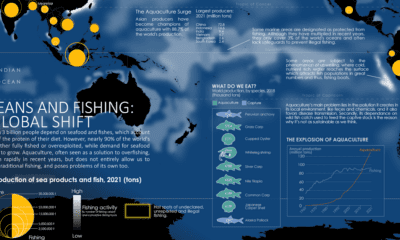

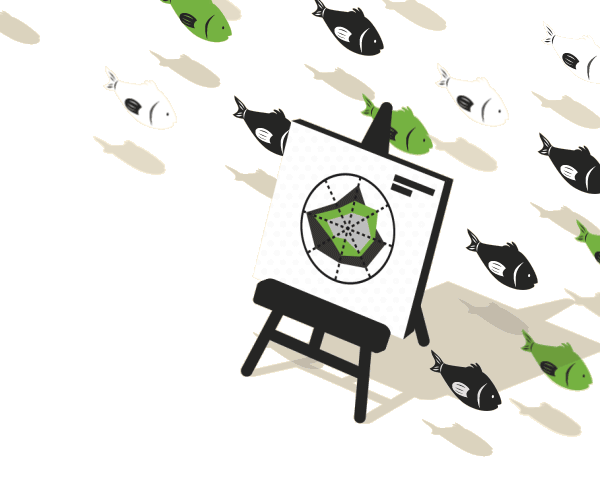
Where do our fish come from? This map charts ocean fishing activity and the amount of fish coming from aquaculture.
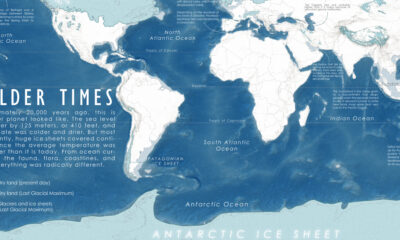

A map of the Earth 20,000 years ago, at the peak of the last ice age, when colder temperatures transformed the planet we know so well.