Travel
What are the World’s Most Populated Islands?
Article/Editing:
![]() See this visualization first on the Voronoi app.
See this visualization first on the Voronoi app.
What are the World’s Most Populated Islands?
This was originally posted on our Voronoi app. Download the app for free on iOS or Android and discover incredible data-driven charts from a variety of trusted sources.
The word “island” tends to bring up images of remote paradise—a brisk sea breeze, waving palms, and inviting beaches, all ingredients for an idyllic life.
However, they can also be hubs for human activity, home to 730 million people, or about 9% of the world’s population.
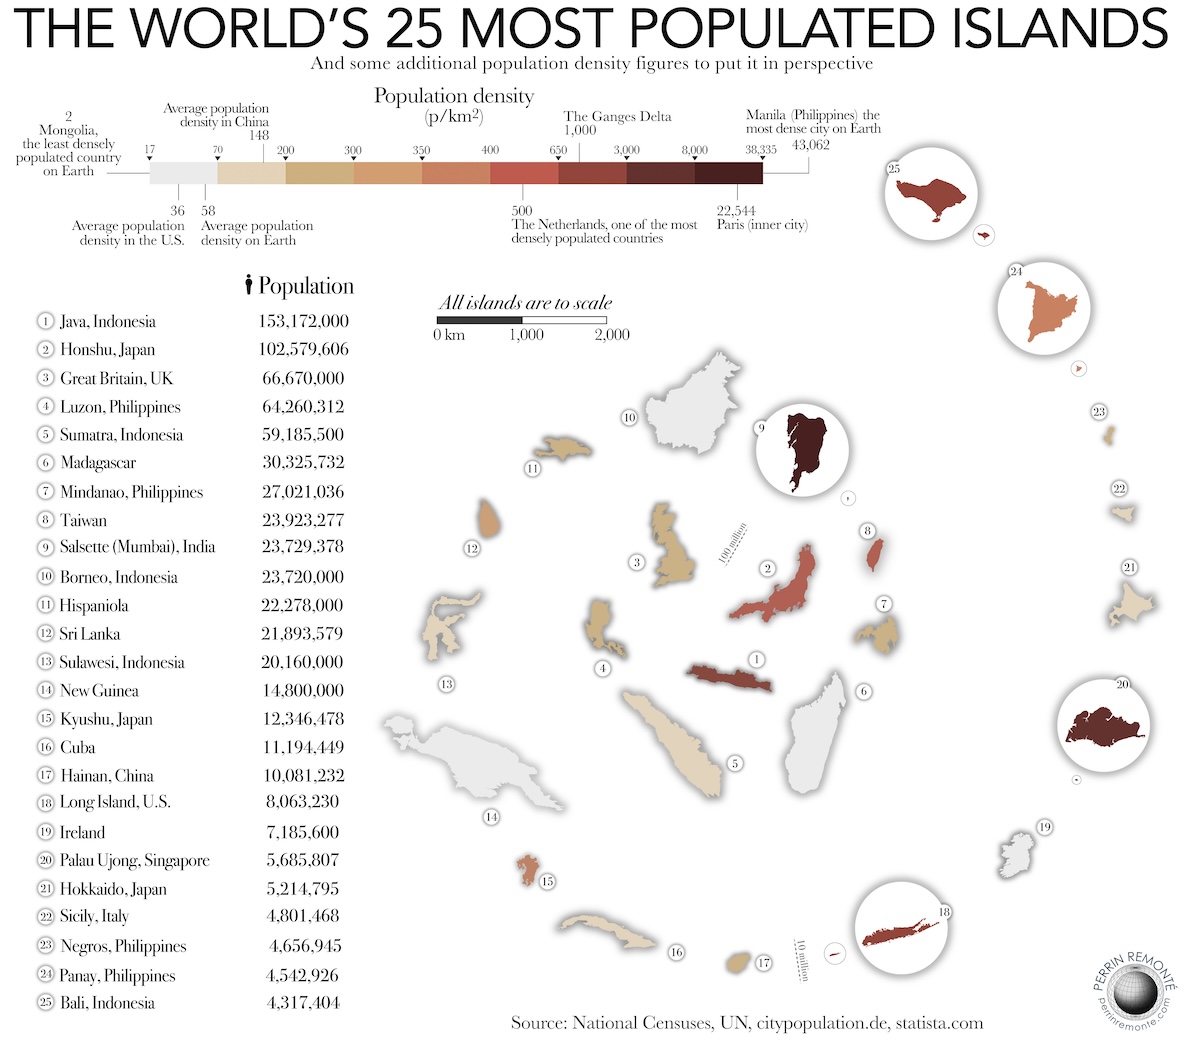
This chart, by creator Perrin Remonté, ranks the 25 most populated islands in the world, colored by their population density patterns, along with an overview of their size relative to each other. Data for this graphic comes from a variety of sources listed at the end of this article.
Ranked: Top 25 Islands by Population
At the top of the list sits Java, Indonesia’s most populous island and the most populous island on Earth. Over 150 million residents inhabit the 130,000 km² landmass, resulting in a density of nearly 1,200 people/km².
Its capital, Jakarta—also the capital of Indonesia—is a vibrant metropolis teeming with skyscrapers, bustling streets, and a rich tapestry of traditions.
Even historically, the island has been the political and economic center of the region: the seat of empires and also the heart of the Indonesian independence movement.
| Rank | Island | Population | Area | Average Density |
|---|---|---|---|---|
| 1 | 🇮🇩 Java, Indonesia | 153M | 130K km2 | 1,177/km2 |
| 2 | 🇯🇵 Honshu, Japan | 103M | 228K km2 | 452/km2 |
| 3 | 🇬🇧 Great Britain, UK | 67M | 209K km2 | 321/km2 |
| 4 | 🇵🇭 Luzon, Philippines | 64M | 105K km2 | 480/km2 |
| 5 | 🇮🇩 Sumatra, Indonesia | 59M | 443K km2 | 133/km2 |
| 6 | 🇲🇬 Madagascar | 30M | 592K km2 | 51/km2 |
| 7 | 🇵🇭 Mindanao, Philippines | 27M | 95K km2 | 284/km2 |
| 8 | 🇹🇼 Taiwan | 24M | 36K km2 | 666/km2 |
| 9 | 🇮🇳 Salsette, India (Mumbai) | 24M | 619 km2 | 38,772/km2 |
| 10 | 🇮🇩 🇲🇾 🇧🇳 Borneo, Indonesia, Malaysia, Brunei | 24M | 751K km2 | 32/km2 |
| 11 | 🇭🇹🇩🇴 Hispaniola, Haiti & Dominican Republic | 22M | 76K km2 | 289/km2 |
| 12 | 🇱🇰 Sri Lanka | 22M | 66K km2 | 333/km2 |
| 13 | 🇮🇩 Sulawesi, Indonesia | 20M | 181K km2 | 110/km2 |
| 14 | 🇮🇩🇵🇬 New Guinea, Indonesia & Papua New Guinea | 15M | 821K km2 | 18/km2 |
| 15 | 🇯🇵 Kyushu, Japan | 12M | 37K km2 | 324/km2 |
| 16 | 🇨🇺 Cuba | 11M | 105K km2 | 105/km2 |
| 17 | 🇨🇳 Hainan, China | 10M | 34K km2 | 294/km2 |
| 18 | 🇺🇸 Long Island, U.S. | 8M | 4K km2 | 2,000/km2 |
| 19 | 🇮🇪 🇬🇧 Ireland, Ireland & UK | 7M | 84K km2 | 83/km2 |
| 20 | 🇸🇬 Singapore Island, Singapore | 6M | 704 km2 | 8,523/km2 |
| 21 | 🇯🇵 Hokkaido, Japan | 5M | 78K km2 | 64/km2 |
| 22 | 🇮🇹 Sicily, Italy | 5M | 26K km2 | 192/km2 |
| 23 | 🇵🇭 Negros, Philippines | 5M | 13K km2 | 385/km2 |
| 24 | 🇵🇭 Panay, Philippines | 5M | 12K km2 | 417/km2 |
| 25 | 🇮🇩 Bali, Indonesia | 4M | 6K km2 | 667/km2 |
Note: Numbers are rounded. Area source: Encyclopaedia Britannica. Population source: See bottom of the article.
Meanwhile, Japan’s Honshu Island ranks second, home to approximately 103 million people. Honshu is the largest and most populous island in Japan, housing iconic cities like Osaka, Kyoto, and Tokyo—the country’s capital, the world’s largest urban area, and one of the three biggest financial centers in Asia.
At third place, Great Britain, the largest of the British Isles, boasts of around 67 million residents, of which England alone accounts for 83% of the population.
Back in Southeast Asia, the island of Luzon, with 64 million people, is home to more than half of the Philippines’ total population.
Coming back to Indonesia, parts of Sumatra, population 59 million, are more along the lines of a postcard picture, from the lush rainforests of Bukit Lawang to the pristine shores of Lake Toba.
In total, Indonesia has six islands on this graphic, with tourist favorite Bali—consistently one of the most popular places to visit—coming in at the 25th spot.
Missing from this list is Australia, home to nearly 30 million people, which would make the top five on this list, were it not for the continent-island debate.
Most Densely Populated Islands
For Salsette Island (ranked 9th by population)—administratively known as Greater Mumbai —magnification is required as it appears as a dot on the scale for the other most populated islands in the world.
Consequently it’s one of the most densely populated islands in the world; at more than 30,000 people/km².
Singapore (ranked 20th), is similarly dense, though not quite at the scale as Mumbai: 8,500 people/km².
Other extremely populated and dense islands in the world include: Manhattan, Haizhu, Guangzhou, and Lagos Island, but none with the total population close to Singapore or Mumbai.
Where Does This Data Come From?
Population sources:
- Citypopulation.de (New Guinea, Sicily, Hainan, Salsette, Singapore).
- Central Statistics Office (Ireland).
- IMF (Hispaniola).
- Philippine Statistics Authority (Luzon, Mindanao, Negros, Panay).
- Statista (Great Britain, Java, Sumatra, Sulawesi, Bali).
- Statistics Bureau of Japan, (Honshu, Hokkaido, Kyushu).
- U.S. Census (Long Island).
- UN (Cuba, Madagascar, Sri Lanka, Taiwan).
Creator Note: For Great Britain and the Indonesian islands, the population figures are reverse engineered from the total population of the country and the percentage share of each island, available on Statista.

This article was published as a part of Visual Capitalist's Creator Program, which features data-driven visuals from some of our favorite Creators around the world.


Markets
Ranked: The World’s Top Flight Routes, by Revenue
In this graphic, we show the highest earning flight routes globally as air travel continued to rebound in 2023.
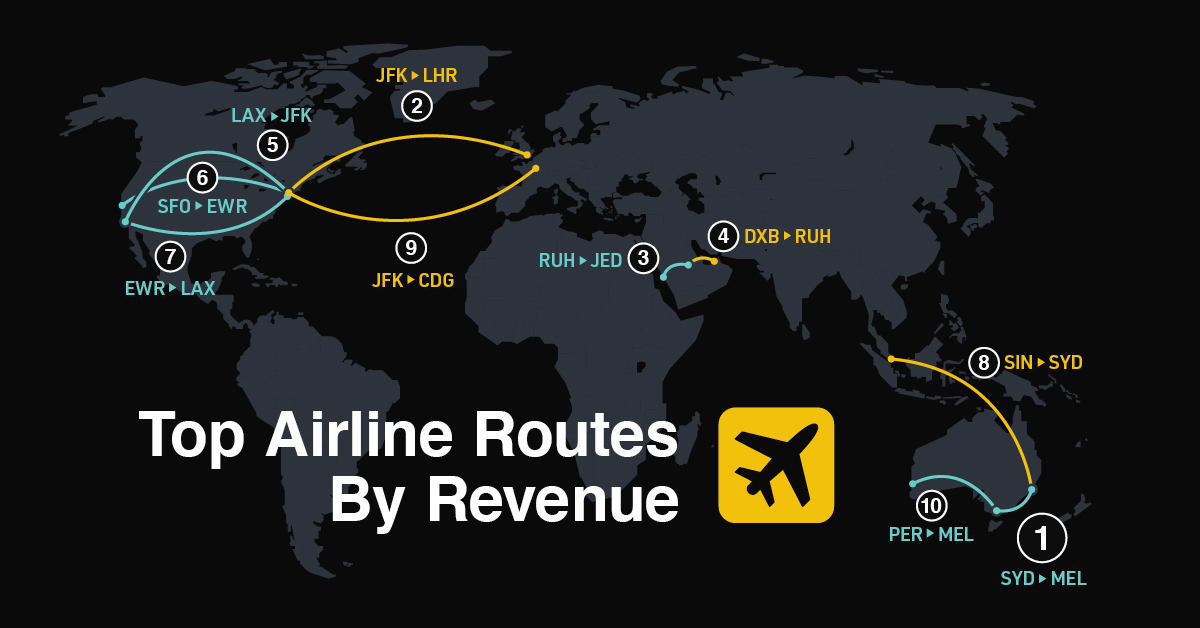
The World’s Top Flight Routes, by Revenue
This was originally posted on our Voronoi app. Download the app for free on iOS or Android and discover incredible data-driven charts from a variety of trusted sources.
In 2024, a record 4.7 billion people are projected to travel by air—200 million more than in 2019.
While revenues surged to an estimated $896 billion globally last year, airlines face extremely slim margins. On average, they made just $5.44 in net profit per passenger in 2023. Today, the industry faces pressures from high interest rates, supply chain woes, and steep infrastructure costs.
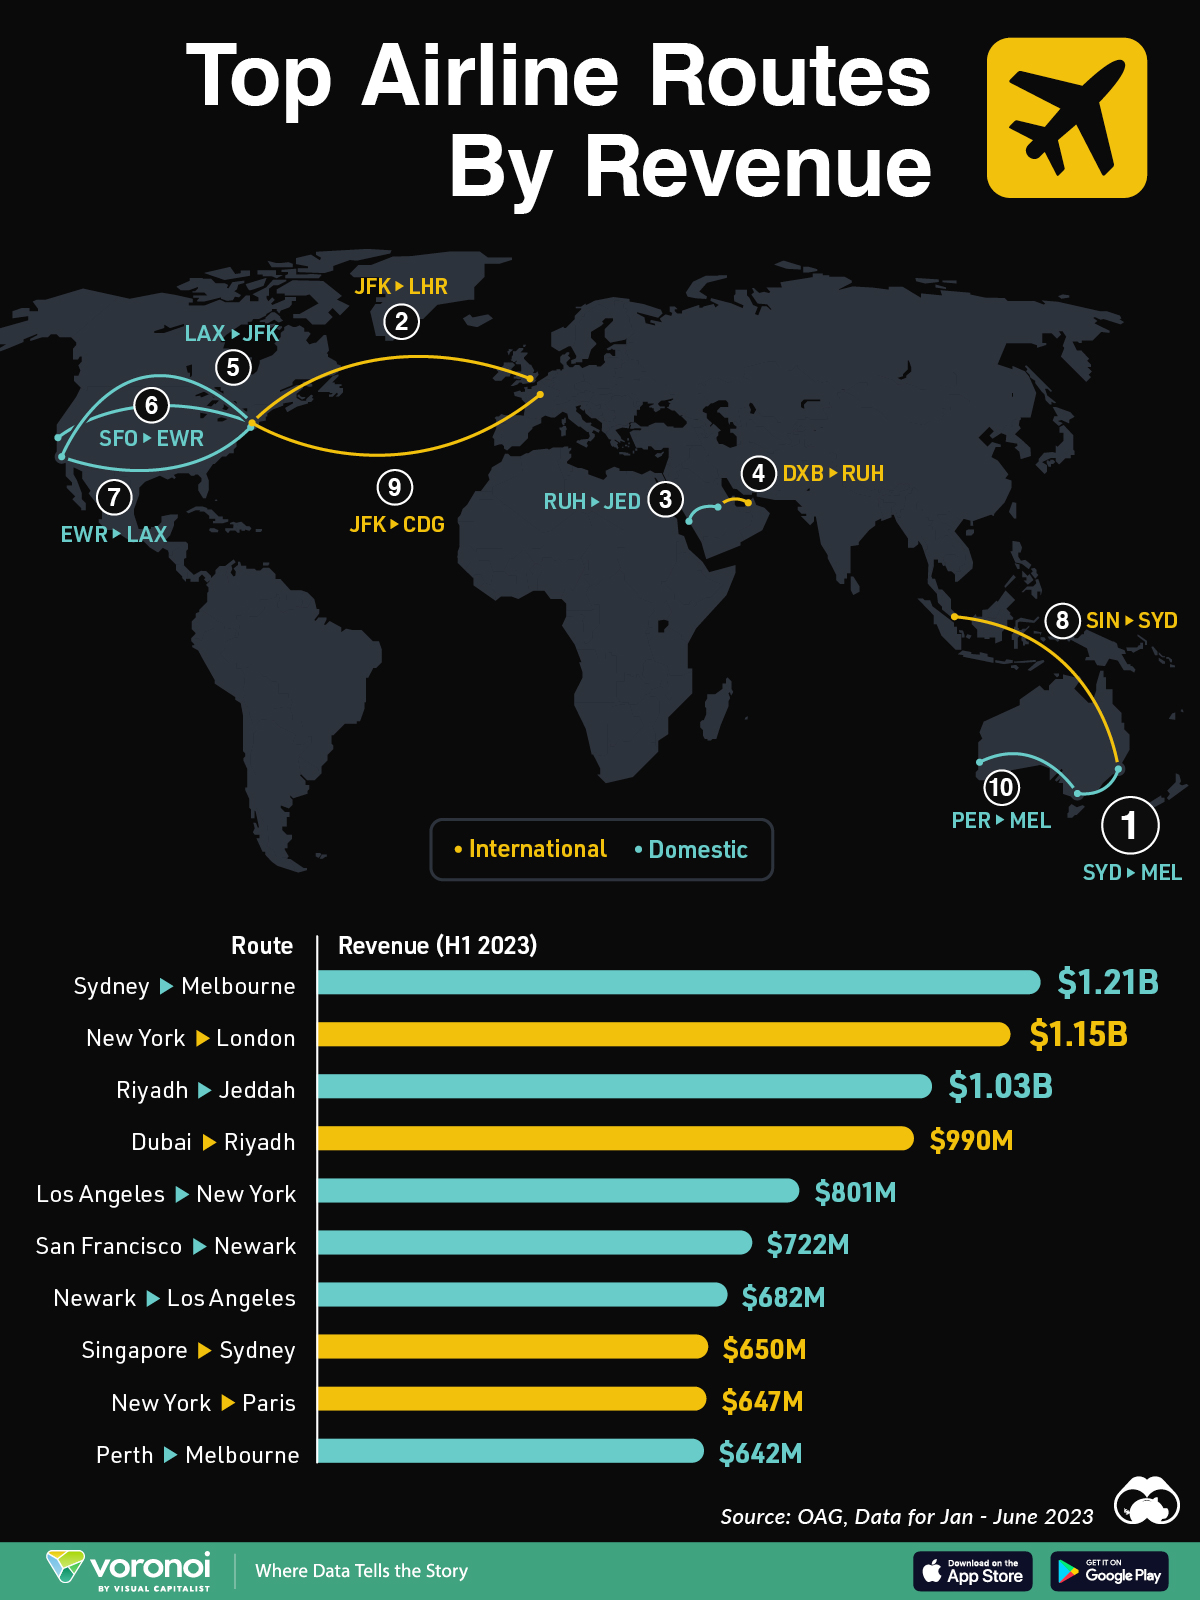
This graphic shows the highest earning flight routes worldwide, based on data from OAG.
The Top Revenue-Generating Routes in 2023
Below, we show the airline routes with the highest revenues in the first half of 2023:
| Route | Airport Codes | Revenue H1 2023 |
|---|---|---|
| Sydney to Melbourne | SYD-MEL | $1.21B |
| New York to London | JFK-LHR | $1.15B |
| Riyadh to Jeddah | RUH-JED | $1.03B |
| Dubai to Riyadh | DXB-RUH | $990M |
| Los Angeles to New York | LAX-JFK | $801M |
| San Francisco to Newark | SFO-EWR | $722M |
| Newark to Los Angeles | EWR-LAX | $682M |
| Singapore to Sydney | SIN-SYD | $650M |
| New York to Paris | JFK-CDG | $647M |
| Perth to Melbourne | PER-MEL | $642M |
As we can see, domestic flights comprised six of the 10 largest revenue-generating flights, with Sydney to Melbourne ranking first overall, at $1.21 billion.
In fact, this route is earning more than twice that of pre-pandemic levels, even as the number of passengers declined. The flight route is largely dominated by Qantas and Virgin Australia, with Qantas achieving record-breaking domestic earnings margins of 18% in the fiscal year ending in June 2023. Lower fuel costs and soaring ticket prices were key factors in driving revenues.
Furthermore, Qantas and Virgin Australia are major carriers for flights between Melbourne and Perth, another top-earning route.
New York to London, one of the busiest and most profitable routes globally, generated $1.15 billion in revenues, representing a 37% increase compared to the same period in 2019. Overall, the flight route had 3.88 million scheduled airline seats for the full year of 2023.
The highest revenue increase over this period was for flights from Dubai to Riyadh, with revenues surging 416% year-over-year. This two-hour flight, a highly lucrative route between major financial centers, is one of the busiest in the Middle East.

-

 Culture1 week ago
The Highest Earning Athletes in Seven Professional Sports
-

 Countries2 weeks ago
Population Projections: The World’s 6 Largest Countries in 2075
-

 Markets2 weeks ago
The Top 10 States by Real GDP Growth in 2023
-

 Demographics2 weeks ago
The Smallest Gender Wage Gaps in OECD Countries
-

 United States2 weeks ago
Where U.S. Inflation Hit the Hardest in March 2024
-

 Green2 weeks ago
Top Countries By Forest Growth Since 2001
-

 United States2 weeks ago
Ranked: The Largest U.S. Corporations by Number of Employees
-

 Maps2 weeks ago
The Largest Earthquakes in the New York Area (1970-2024)