Misc
Visualizing the World’s 100 Biggest Islands
View the full-size version of the infographic.
Visualizing 100 of the World’s Biggest Islands
View the full-size version of the infographic by clicking here.
When you think of an island, the first thing that might come to mind is a small, sunny beach surrounded by warm waters. But did you know that 11% of the world’s population actually calls islands their home?
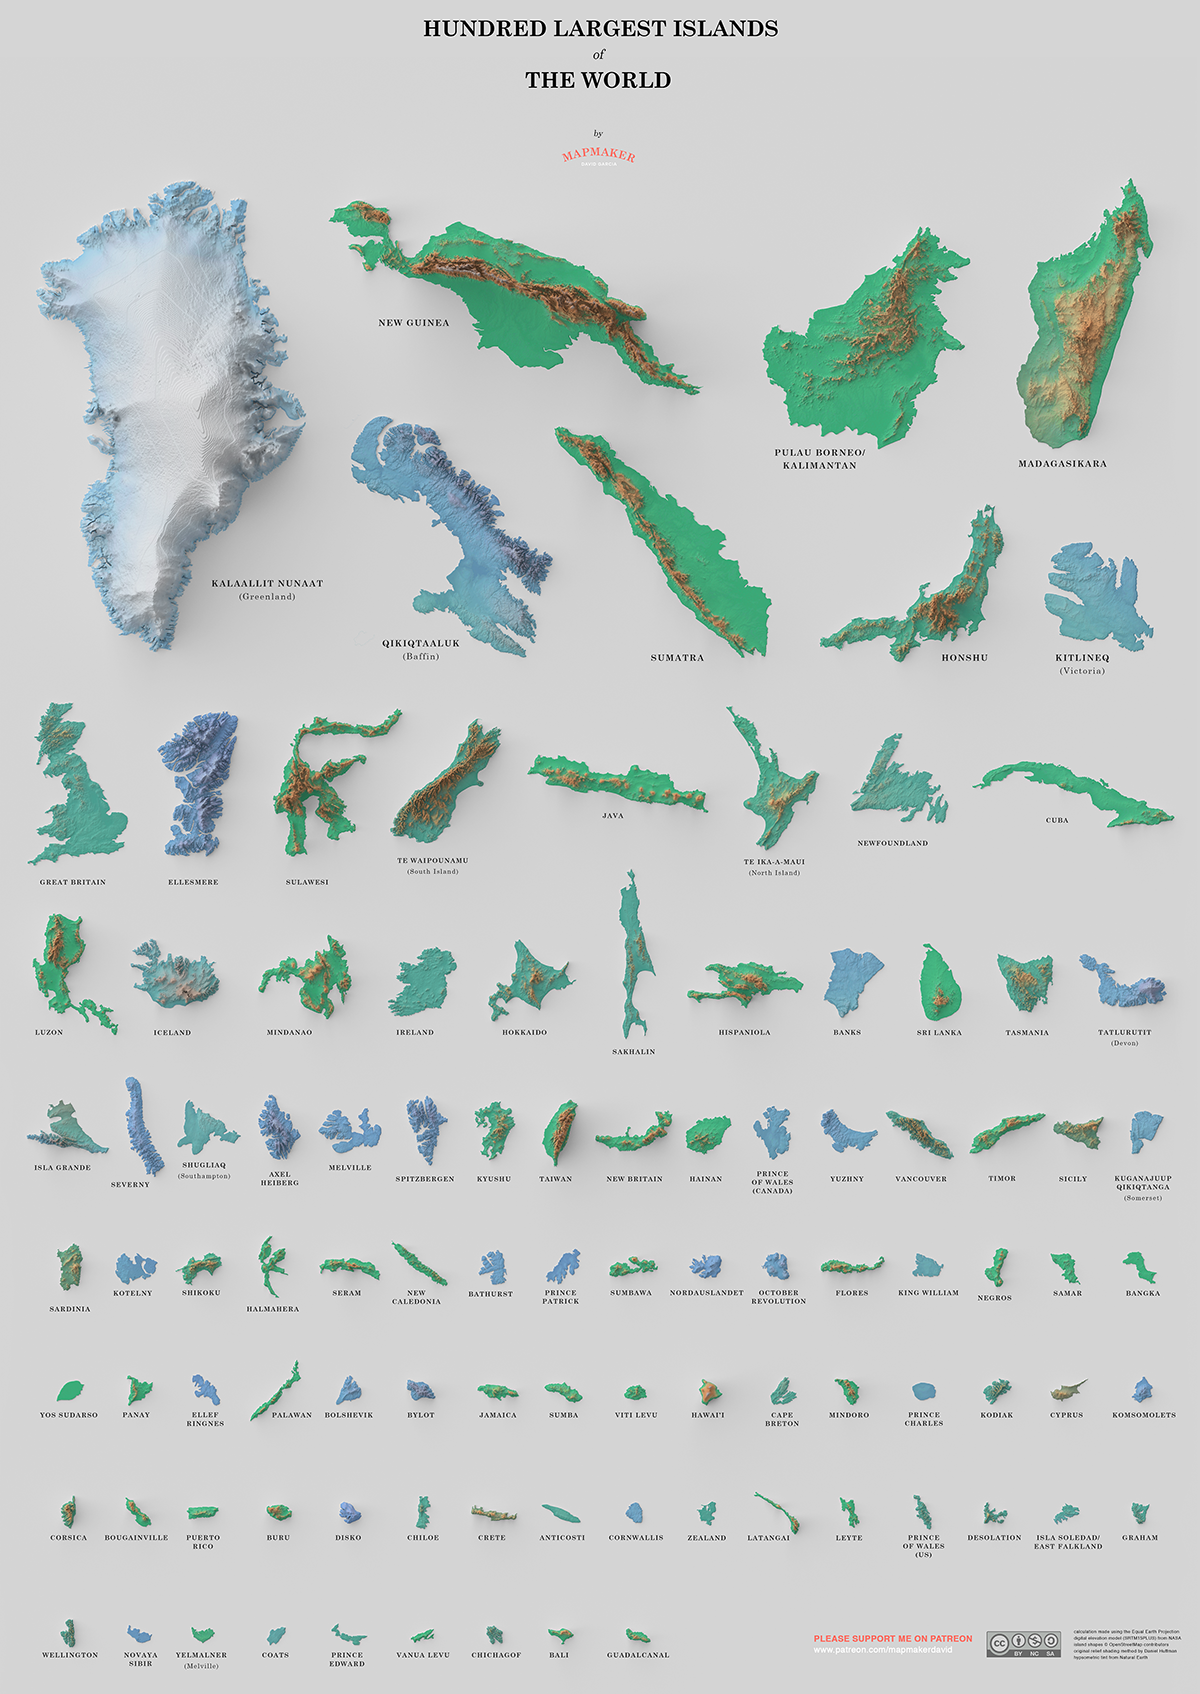
Today’s data visualization is designed by mapmaker David Garcia, and it ranks the 100 largest islands found around the world by size.
Islands in the Stream
The 100 biggest islands range from the likes of expansive Greenland to independent Guadalcanal, the largest of the Solomon Islands. But look a little closer, and you’ll see just how much the top contender outshines the rest. Greenland is almost three times the size of the second-biggest island of New Guinea, and you could fit over 408 Guadalcanal islands within it.
In the visualization, the islands are also tinted, depending on the climate they come from. Blue islands are from the polar regions, turquoise islands lie in the temperate zones, and green islands represent the lush tropics. Which of these regions hosts the most islands?
| Island | Countries | Region |
|---|---|---|
| Kalaallit Nunaat (Greenland) | Denmark | Europe |
| New Guinea | Papua New Guinea, Indonesia | Oceania |
| Pulau Borneo (Kalimantan) | Indonesia, Malaysia, Brunei | Asia |
| Madagasikara | Madagascar | Africa |
| Qikiqtaaluk (Baffin Island, Nunavut) | Canada | North America |
| Sumatra | Indonesia | Asia |
| Honshu | Japan | Asia |
| Kitlineq (Victoria Island) | Canada | North America |
| Great Britain | United Kingdom | Europe |
| Ellesmere (Nunavut) | Canada | North America |
| Sulawesi | Indonesia | Asia |
| Te Waipounamu (South Island) | New Zealand | Oceania |
| Java | Indonesia | Asia |
| Te Ika-a-maui (North Island) | New Zealand | Oceania |
| Newfoundland | Canada | North America |
| Cuba | Cuba | North America |
| Luzon | Philippines | Asia |
| Iceland | Iceland | Europe |
| Mindanao | Philippines | Asia |
| Ireland | Ireland, United Kingdom | Europe |
| Hokkaido | Japan | Asia |
| Sakhalin | Russia | Eurasia |
| Hispaniola | Dominican Republic, Haiti | North America |
| Banks Island | Canada | North America |
| Sri Lanka | Sri Lanka | Asia |
| Tasmania | Australia | Oceania |
| Tatlurutit (Devon Island, Nunavut) | Canada | North America |
| Isla Grande de Tierra del Fuego | Panama | South America |
| Severny | Russia | Eurasia |
| Shugliaq (Southampton) | Canada | North America |
| Axel Heiberg (Nunavut) | Canada | North America |
| Melville | Canada | North America |
| Spitsbergen (Svalbard) | Norway | Europe |
| Kyushu | Japan | Asia |
| Taiwan | Taiwan | Asia |
| New Britain | Papua New Guinea | Oceania |
| Hainan | China | Asia |
| Prince of Wales (Nunavut) | Canada | North America |
| Yuzhny | Russia | Eurasia |
| Vancouver | Canada | North America |
| Timor | Timor Leste | Asia |
| Sicily | Italy | Europe |
| Kuganajuup Qikiqtanga (Somerset, Nunavut) | Canada | North America |
| Sardinia | Italy | Europe |
| Kotelny | Russia | Eurasia |
| Shikoku | Japan | Asia |
| Halmahera | Indonesia | Asia |
| Seram | Indonesia | Asia |
| New Caledonia | France | Europe |
| Bathurst (Nunavut) | Canada | North America |
| Prince Patrick | Canada | North America |
| Sumbawa | Indonesia | Asia |
| Nordaustlandet | Norway | Europe |
| October Revolution | Russia | Eurasia |
| Flores | Indonesia | Asia |
| King William (Nunavut) | Canada | North America |
| Negros | Philippines | Asia |
| Samar | Philippines | Asia |
| Bangka | Indonesia | Asia |
| Yos Sudarso | Papua New Guinea | Oceania |
| Panay | Philippines | Asia |
| Ellef Ringnes (Nunavut) | Canada | North America |
| Palawan | Philippines | Asia |
| Bolshevik | Russia | Eurasia |
| Bylot (Nunavut) | Canada | North America |
| Jamaica | Caribbean | North America |
| Sumba | Indonesia | Asia |
| Viti Levu | Fiji | Oceania |
| Hawai'I (Big Island) | United States | North America |
| Cape Breton | Canada | North America |
| Mindoro | Philippines | Asia |
| Prince Charles | Canada | North America |
| Kodiak (Alaska) | United States | North America |
| Cyprus | Cyprus, United Kingdom | Europe |
| Komsomolets | Russia | Eurasia |
| Corsica | France | Europe |
| Bougainville | Papua New Guinea | Oceania |
| Puerto Rico | United States | North America |
| Buru | Indonesia | Asia |
| Disko | Greenland | Europe |
| Chiloé | Chile | South America |
| Crete | Greece | Europe |
| Anticosti | Canada | North America |
| Cornwallis (Nunavut) | Canada | North America |
| Zealand | Denmark | Europe |
| Latangai (New Ireland) | Papua New Guinea | Oceania |
| Leyte | Philippines | Asia |
| Prince of Wales (Alaska) | United States | North America |
| Desolation (Kerguelen) | Antarctic Lands, France | Antarctic |
| Isla Soledad/ East Falkland | Argentina | South America |
| Graham | Canada | North America |
| Wellington | Chile | South America |
| Novaya Sibir (New Siberian) | Russia | Eurasia |
| Yelmalner/ Melville | Australia | Oceania |
| Coats (Nunavut) | Canada | North America |
| Prince Edward | Canada | North America |
| Vanua Levu | Fiji | Oceania |
| Chichagof (Alaska) | United States | North America |
| Bali | Indonesia | Asia |
| Guadalcanal | Solomon Islands | Oceania |
It’s the Island Life for Many
North America dominates with 32 islands out of the top 100, but there’s a catch — twelve of them are uninhabitable, thanks to the frigid Arctic temperatures.
Throw the number of people into the mix and the regional overview gets even more interesting. Compared to the rest of the world, Asian islands are teeming with life.
- 28 Asian islands
Total population: 510.4 million - 14 European islands
Total population: 83.8 million - 32 North American islands
Total population: 40.7 million - 12 Oceania islands
Total population: 18.3 million
Taking things a step further, we’ve remixed the visualization based on population density.
Click below to view the full-size version.
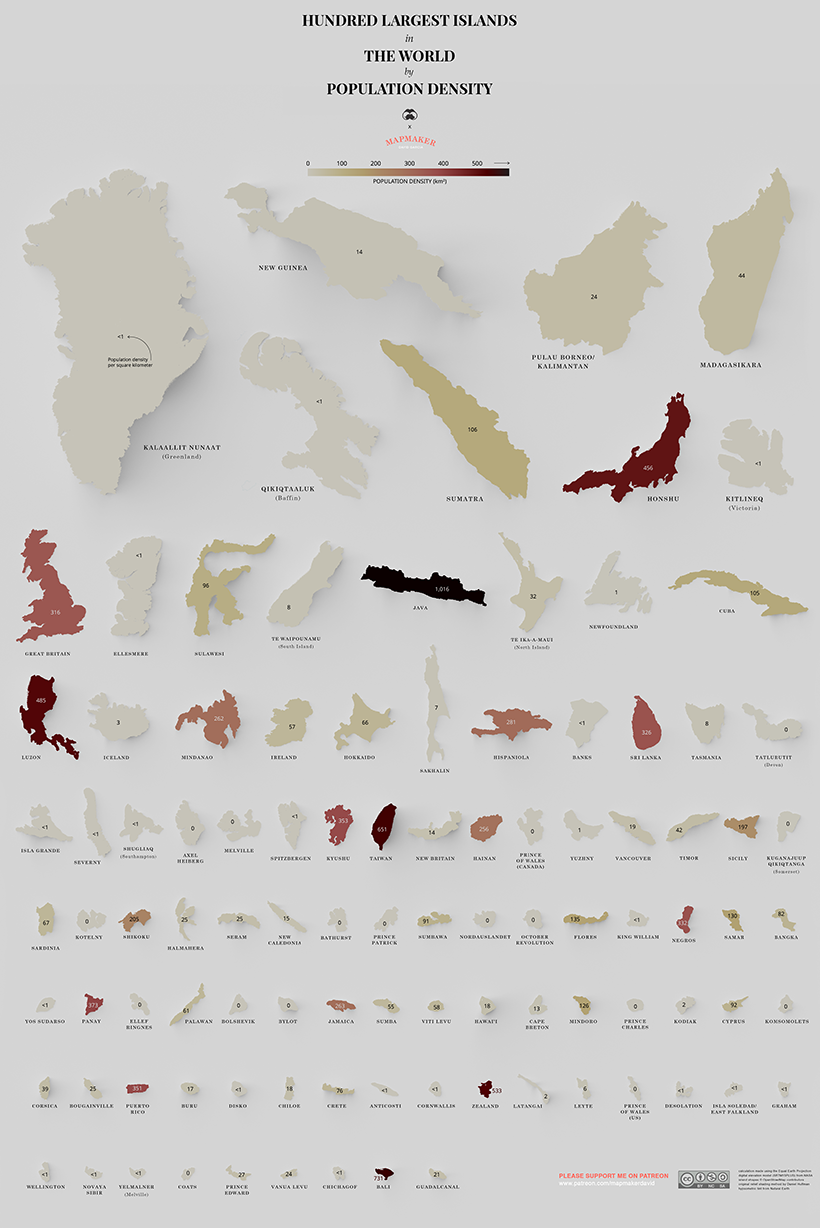
The most populated island in the world, Java is filled to the brim with 141 million people — that’s over a thousand people per square kilometer. This is in part thanks to the capital city Jakarta being located on the island, but experts warn those days may be short-lived. By 2050, scientific models predict that 95% of the city may be underwater, and that Indonesia must scramble to find a new capital.
To finish, here is the 20 most dense islands on the list, in terms of population density.
| Rank by Density | Island | Countries | Population | Area (km²) | People per km² |
|---|---|---|---|---|---|
| #1 | Java | Indonesia | 141,000,000 | 138,793 | 1,015.9 |
| #2 | Bali | Indonesia | 4,225,000 | 5,780 | 731.0 |
| #3 | Taiwan | Taiwan | 23,571,000 | 36,193 | 651.3 |
| #4 | Zealand | Denmark | 3,749,200 | 7,031 | 533.2 |
| #5 | Luzon | Philippines | 53,336,134 | 109,965 | 485.0 |
| #6 | Honshu | Japan | 104,000,000 | 227,960 | 456.2 |
| #7 | Panay | Philippines | 4,477,247 | 12,011 | 372.8 |
| #8 | Kyushu | Japan | 12,970,479 | 36,753 | 352.9 |
| #9 | Puerto Rico | United States | 3,195,000 | 9,104 | 350.9 |
| #10 | Negros | Philippines | 4,414,131 | 13,310 | 331.6 |
| #11 | Sri Lanka | Sri Lanka | 21,440,000 | 65,610 | 326.8 |
| #12 | Great Britain | United Kingdom | 66,040,000 | 209,331 | 315.5 |
| #13 | Hispaniola | Dominican Republic, Haiti | 21,396,000 | 76,192 | 280.8 |
| #14 | Jamaica | Caribbean | 2,890,000 | 10,992 | 262.9 |
| #15 | Mindanao | Philippines | 25,537,691 | 97,530 | 261.8 |
| #16 | Hainan | China | 8,670,000 | 33,920 | 255.6 |
| #17 | Shikoku | Japan | 3,845,534 | 18800 | 204.5 |
| #18 | Sicily | Italy | 5,057,000 | 25,711 | 196.7 |
| #19 | Flores | Indonesia | 1,831,000 | 13,540 | 135.2 |
| #20 | Samar | Philippines | 1,751,267 | 13,429 | 130.4 |
The Australia-Island Debate
Upon first publishing this over two years ago, the most common feedback we heard came from our friends Down Under.
In school, many Australians learned that their beloved country was an “island continent”, and naturally felt it should be included on the list of the world’s 100 biggest islands.
As with anything, there are different schools of thought on this. Upon digging deeper, we believed that Encyclopedia Britannica had a explanatory take on the issue:
“Most geographers consider islands and continents to be separate things. An island is a mass of land that is both ‘entirely surrounded by water’ and also ‘smaller than a continent.’ By that definition, Australia can’t be an island because it’s already a continent.”
–Encyclopedia Britannica
There are, of course, opposing arguments that could be had—but at least this gives some perspective on why Australia was likely excluded from this particular list.
This post was first published in 2019. We have since updated it, adding in new content for 2021.


Misc
How Hard Is It to Get Into an Ivy League School?
We detail the admission rates and average annual cost for Ivy League schools, as well as the median SAT scores required to be accepted.


How Hard Is It to Get Into an Ivy League School?
This was originally posted on our Voronoi app. Download the app for free on iOS or Android and discover incredible data-driven charts from a variety of trusted sources.
Ivy League institutions are renowned worldwide for their academic excellence and long-standing traditions. But how hard is it to get into one of the top universities in the U.S.?
In this graphic, we detail the admission rates and average annual cost for Ivy League schools, as well as the median SAT scores required to be accepted. The data comes from the National Center for Education Statistics and was compiled by 24/7 Wall St.
Note that “average annual cost” represents the net price a student pays after subtracting the average value of grants and/or scholarships received.
Harvard is the Most Selective
The SAT is a standardized test commonly used for college admissions in the United States. It’s taken by high school juniors and seniors to assess their readiness for college-level academic work.
When comparing SAT scores, Harvard and Dartmouth are among the most challenging universities to gain admission to. The median SAT scores for their students are 760 for reading and writing and 790 for math. Still, Harvard has half the admission rate (3.2%) compared to Dartmouth (6.4%).
| School | Admission rate (%) | SAT Score: Reading & Writing | SAT Score: Math | Avg Annual Cost* |
|---|---|---|---|---|
| Harvard University | 3.2 | 760 | 790 | $13,259 |
| Columbia University | 3.9 | 750 | 780 | $12,836 |
| Yale University | 4.6 | 760 | 780 | $16,341 |
| Brown University | 5.1 | 760 | 780 | $26,308 |
| Princeton University | 5.7 | 760 | 780 | $11,080 |
| Dartmouth College | 6.4 | 760 | 790 | $33,023 |
| University of Pennsylvania | 6.5 | 750 | 790 | $14,851 |
| Cornell University | 7.5 | 750 | 780 | $29,011 |
*Costs after receiving federal financial aid.
Additionally, Dartmouth has the highest average annual cost at $33,000. Princeton has the lowest at $11,100.
While student debt has surged in the United States in recent years, hitting $1.73 trillion in 2023, the worth of obtaining a degree from any of the schools listed surpasses mere academics. This is evidenced by the substantial incomes earned by former students.
Harvard grads, for example, have the highest average starting salary in the country, at $91,700.

-

 Real Estate2 weeks ago
Visualizing America’s Shortage of Affordable Homes
-

 Technology1 week ago
Ranked: Semiconductor Companies by Industry Revenue Share
-

 Money1 week ago
Which States Have the Highest Minimum Wage in America?
-

 Real Estate1 week ago
Ranked: The Most Valuable Housing Markets in America
-

 Business2 weeks ago
Charted: Big Four Market Share by S&P 500 Audits
-

 AI2 weeks ago
The Stock Performance of U.S. Chipmakers So Far in 2024
-

 Misc2 weeks ago
Almost Every EV Stock is Down After Q1 2024
-

 Money2 weeks ago
Where Does One U.S. Tax Dollar Go?