

See how the world's 6 largest countries will grow (or shrink) by 2075, based on the latest UN population projections.


By 2050, one in six people will be aged 65 or older. Here, we map the growth of the senior population by region.
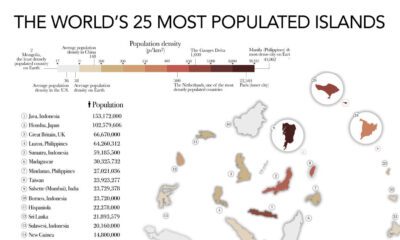

The most populated islands of the earth are teeming hubs of human activity, a far cry from the remote paradises in popular imaginations.


We visualize Asia’s population patterns to see where 4.6 billion people, or two-thirds of the world’s population, actually live.


Japan’s birth rate has been declining. Here, we illustrate the number of live births each year compared to the number of annual deaths.


In this visualization, we map the populations of major regions at three different points in time: 1900, 2000, and 2050 (forecasted).


Despite the consumer class growing worldwide, some countries are predicted to see a decline in the number of consumers over the next decade.


From someone born in the 19th century, in the midst of historic population growth, comes this vintage visualization showing world cities growing ever bigger.


To offer perspective on the population of U.S. states, this map compares them to countries that share similar population sizes.
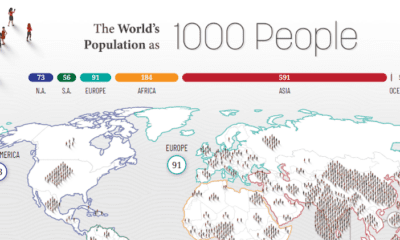

How would all the people in the world be spread out if there were only 1,000 people on Earth? This interactive map examines the breakdown.


 Creator Program