Maps
Ranked: The World’s Largest Cities By Population
Ranked: The World’s Largest Cities By Population
The world has experienced rapid urbanization over the last century.
Today, more than 4.3 billion people live in urban settings, or 55% of the world’s population.
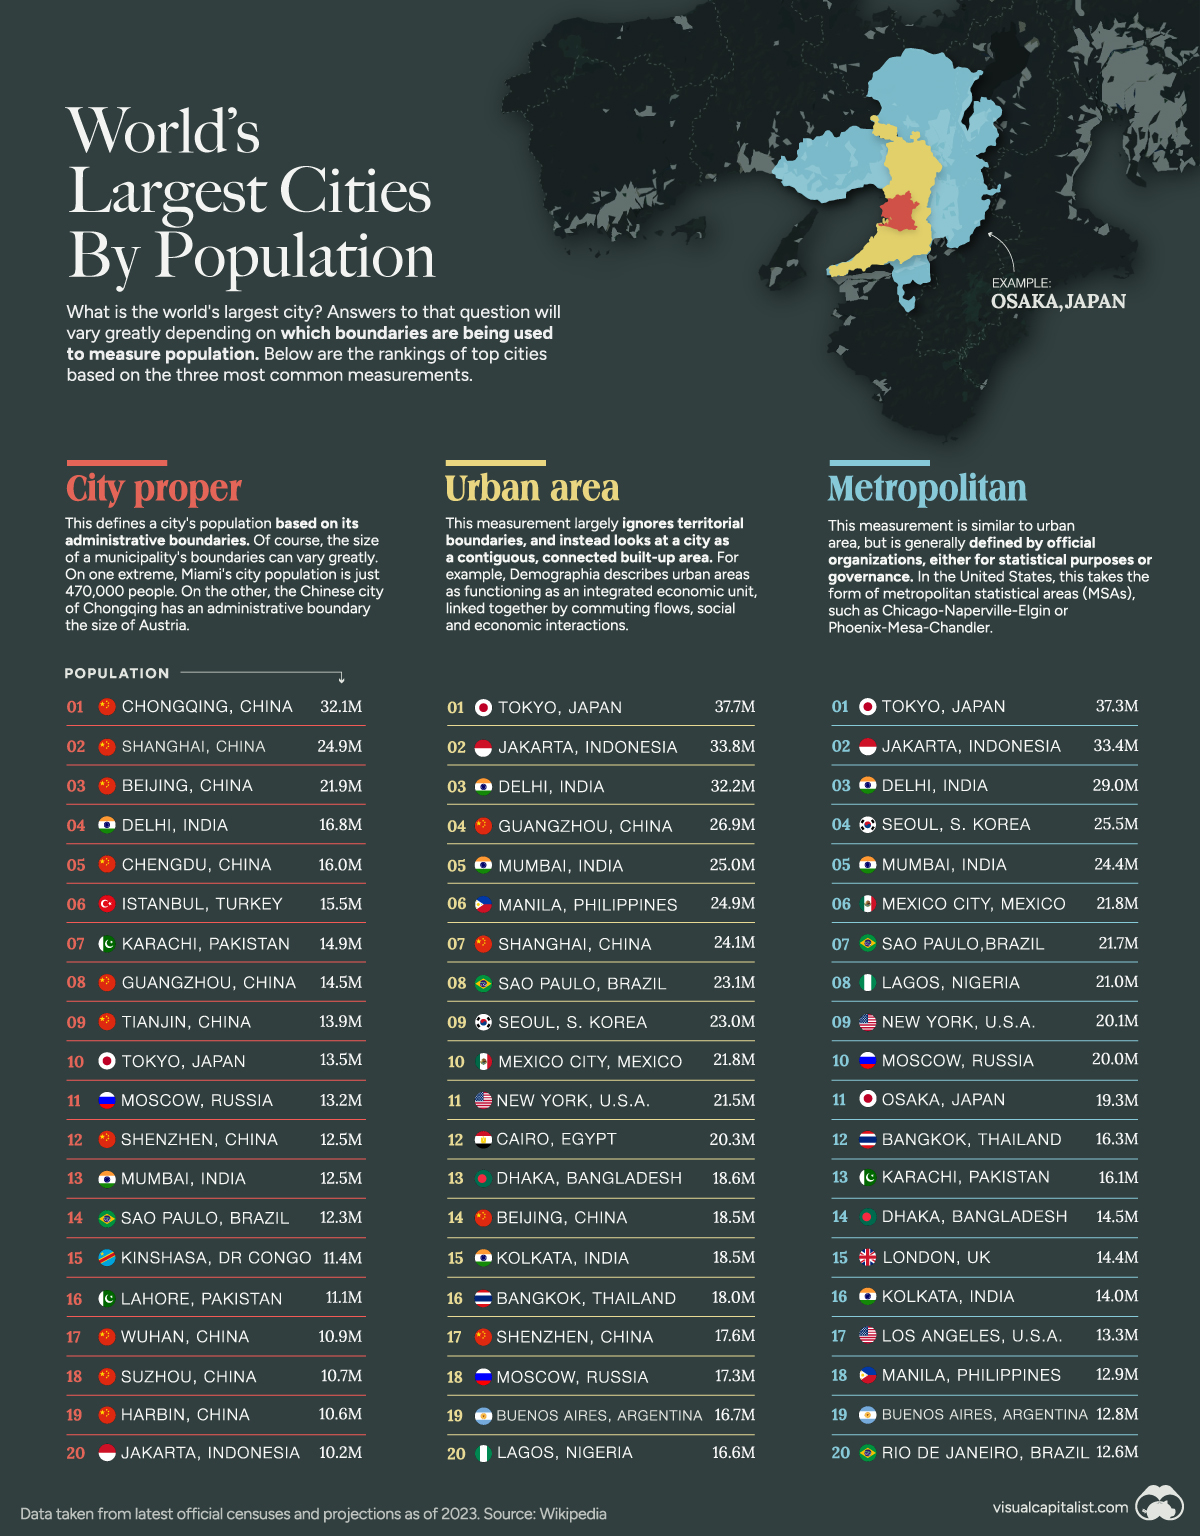
But what is the world’s largest city? Answers to that question will vary greatly depending on which lines are being used to demarcate city boundaries and measure their populations.
The graphic above uses data taken from the latest official censuses and projections to rank the top cities based on the three most common metrics.
The Largest Cities by City Proper
Our first metric is based on the city proper, meaning the administrative boundaries.
According to the United Nations, a city proper is “the single political jurisdiction which contains the historical city center.”
The Chinese city of Chongqing leads the ranks by this metric and has an administrative boundary the size of Austria, with an urban population of 32.1 million.
The city’s monorail system holds records for being the world’s longest and busiest, boasting 70 stations. Chongqing Jiangbei International Airport, is among the world’s top 50 busiest airports. Additionally, the city ranks among the globe’s top 50 hubs for scientific research.
Other Chinese cities dominate the ranking by this metric:
| Rank | City | Population (Million) |
|---|---|---|
| #1 | 🇨🇳 Chongqing | 32.1m |
| #2 | 🇨🇳 Shanghai | 24.9m |
| #3 | 🇨🇳 Beijing | 21.9m |
| #4 | 🇮🇳 Delhi | 16.8m |
| #5 | 🇨🇳 Chengdu | 16.0m |
| #6 | 🇹🇷 Istanbul | 15.5m |
| #7 | 🇵🇰 Karachi | 14.9m |
| #8 | 🇨🇳 Guangzhou | 14.5m |
| #9 | 🇨🇳 Tianjin | 13.9m |
| #10 | 🇯🇵 Tokyo | 13.5m |
The first non-Chinese city, Delhi, has been experiencing one of the fastest urban expansions in the world.
The United Nations projects India will add over 400 million urban dwellers by 2050, compared to 250 million people in China and 190 million in Nigeria.
The Largest Cities by Urban Area
This measurement largely ignores territorial boundaries and considers a city a contiguous, connected built-up area.
Demographia describes urban areas as functioning as an integrated economic unit, linked by commuting flows, social, and economic interactions.
By this metric, Tokyo leads the ranking:
| Rank | City | Population (Million) |
|---|---|---|
| #1 | 🇯🇵 Tokyo | 37.7m |
| #2 | 🇮🇩 Jakarta | 33.8m |
| #3 | 🇮🇳 Delhi | 32.2m |
| #4 | 🇨🇳 Guangzhou | 26.9m |
| #5 | 🇮🇳 Mumbai | 25.0m |
| #6 | 🇵🇭 Manila | 24.9m |
| #7 | 🇨🇳 Shanghai | 24.1m |
| #8 | 🇧🇷 Sao Paulo | 23.1m |
| #9 | 🇰🇷 Seoul | 23.0m |
| #10 | 🇲🇽 Mexico City | 21.8m |
The city proper houses about 10% of Japan’s population. If the greater Tokyo metro area is considered, including cities like Kanagawa, Saitama, and Chiba, then Tokyo’s total population surpasses 37 million—about 30% of the country total.
Consequently, even with one of the world’s largest railway systems, trains in Tokyo are incredibly crowded, with a boarding rate of 200% during peak time in the most overcrowded areas. The city is also famous for its Shibuya Crossing, the busiest intersection on the planet.
The Largest Cities by Metropolitan Area
Tokyo also leads by our final metric, metropolitan area.
This measurement is similar to urban area, but is generally defined by official organizations, either for statistical purposes or governance.
In the United States, this takes the form of metropolitan statistical areas (MSAs), such as Chicago-Naperville-Elgin or Phoenix-Mesa-Chandler.
| Rank | City | Population (Million) |
|---|---|---|
| #1 | 🇯🇵 Tokyo | 37.3m |
| #2 | 🇮🇩 Jakarta | 33.4m |
| #3 | 🇮🇳 Delhi | 29.0m |
| #4 | 🇰🇷 Seoul | 25.5m |
| #5 | 🇮🇳 Mumbai | 24.4m |
| #6 | 🇲🇽 Mexico City | 21.8m |
| #7 | 🇧🇷 Sao Paulo | 21.7m |
| #8 | 🇳🇬 Lagos | 21.0m |
| #9 | 🇺🇸 New York | 20.1m |
| #10 | 🇷🇺 Moscow | 20.0m |
As the global urban population continues to rise, new cities, especially in Africa and Asia, are expected to vie for the “largest” tag soon.
The UN projects that by 2050, 68% of the world will live in urban areas.


Maps
The Largest Earthquakes in the New York Area (1970-2024)
The earthquake that shook buildings across New York in April 2024 was the third-largest quake in the Northeast U.S. over the past 50 years.


The Largest Earthquakes in the New York Area
This was originally posted on our Voronoi app. Download the app for free on Apple or Android and discover incredible data-driven charts from a variety of trusted sources.
The 4.8 magnitude earthquake that shook buildings across New York on Friday, April 5th, 2024 was the third-largest quake in the U.S. Northeast area over the past 50 years.
In this map, we illustrate earthquakes with a magnitude of 4.0 or greater recorded in the Northeastern U.S. since 1970, according to the United States Geological Survey (USGS).
Shallow Quakes and Older Buildings
The earthquake that struck the U.S. Northeast in April 2024 was felt by millions of people from Washington, D.C., to north of Boston. It even caused a full ground stop at Newark Airport.
The quake, occurring just 5 km beneath the Earth’s surface, was considered shallow, which is what contributed to more intense shaking at the surface.
According to the USGS, rocks in the eastern U.S. are significantly older, denser, and harder than those on the western side, compressed by time. This makes them more efficient conduits for seismic energy. Additionally, buildings in the Northeast tend to be older and may not adhere to the latest earthquake codes.
Despite disrupting work and school life, the earthquake was considered minor, according to the Michigan Technological University magnitude scale:
| Magnitude | Earthquake Effects | Estimated Number Each Year |
|---|---|---|
| 2.5 or less | Usually not felt, but can be recorded by seismograph. | Millions |
| 2.5 to 5.4 | Often felt, but only causes minor damage. | 500,000 |
| 5.5 to 6.0 | Slight damage to buildings and other structures. | 350 |
| 6.1 to 6.9 | May cause a lot of damage in very populated areas. | 100 |
| 7.0 to 7.9 | Major earthquake. Serious damage. | 10-15 |
| 8.0 or greater | Great earthquake. Can totally destroy communities near the epicenter. | One every year or two |
The largest earthquake felt in the area over the past 50 years was a 5.3 magnitude quake that occurred in Au Sable Forks, New York, in 2002. It damaged houses and cracked roads in a remote corner of the Adirondack Mountains, but caused no injuries.
| Date | Magnitude | Location | State |
|---|---|---|---|
| April 20, 2002 | 5.3 | Au Sable Forks | New York |
| October 7, 1983 | 5.1 | Newcomb | New York |
| April 5, 2024 | 4.8 | Whitehouse Station | New Jersey |
| October 16, 2012 | 4.7 | Hollis Center | Maine |
| January 16, 1994 | 4.6 | Sinking Spring | Pennsylvania |
| January 19, 1982 | 4.5 | Sanbornton | New Hampshire |
| September 25, 1998 | 4.5 | Adamsville | Pennsylvania |
| June 9, 1975 | 4.2 | Altona | New York |
| May 29, 1983 | 4.2 | Peru | Maine |
| April 23, 1984 | 4.2 | Conestoga | Pennsylvania |
| January 16, 1994 | 4.2 | Sinking Spring | Pennsylvania |
| November 3, 1975 | 4 | Long Lake | New York |
| June 17, 1991 | 4 | Worcester | New York |
The largest earthquake in U.S. history, however, was the 1964 Good Friday quake in Alaska, measuring 9.2 magnitude and killing 131 people.

-

 Education1 week ago
How Hard Is It to Get Into an Ivy League School?
-

 Technology2 weeks ago
Ranked: Semiconductor Companies by Industry Revenue Share
-

 Markets2 weeks ago
Ranked: The World’s Top Flight Routes, by Revenue
-

 Demographics2 weeks ago
Population Projections: The World’s 6 Largest Countries in 2075
-

 Markets2 weeks ago
The Top 10 States by Real GDP Growth in 2023
-

 Demographics2 weeks ago
The Smallest Gender Wage Gaps in OECD Countries
-

 Economy2 weeks ago
Where U.S. Inflation Hit the Hardest in March 2024
-

 Environment2 weeks ago
Top Countries By Forest Growth Since 2001