Demographics
Mapped: The Dramatic Global Rise of Urbanization (1950–2020)
The Dramatic Global Rise of Urbanization (1950–2020)
In the 21st century, few trends have matched the economic, environmental, and societal impact of rapid urbanization.
A steady stream of human migration out of the countryside, and into swelling metropolitan centers, has shaken up the world’s power dynamic in just decades.
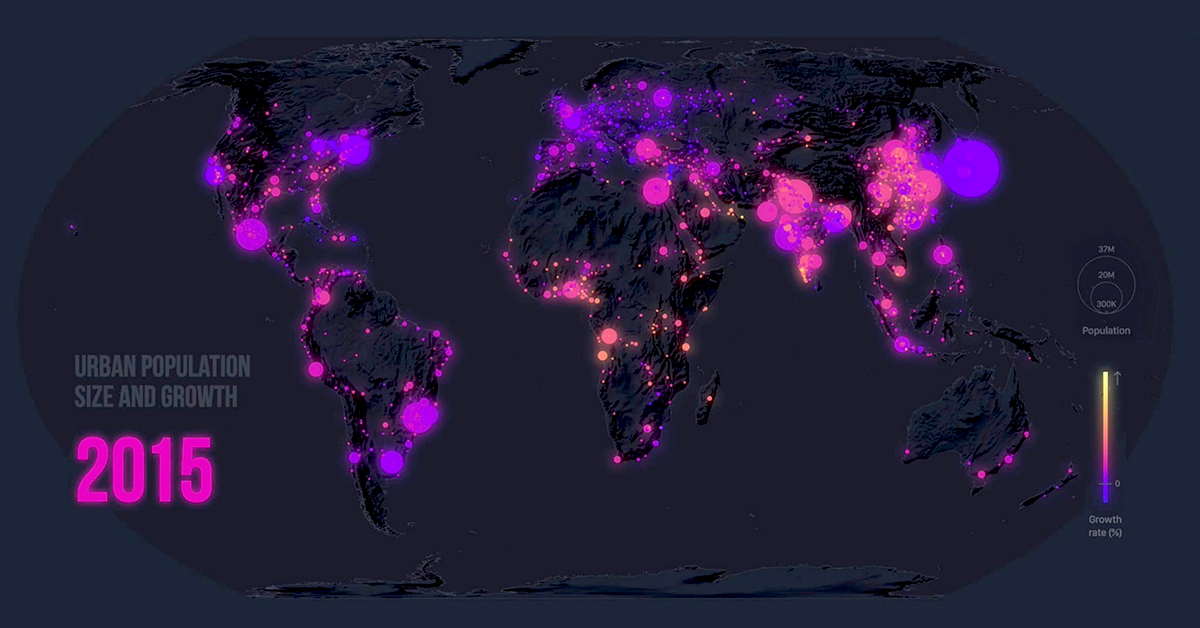
Today’s eye-catching map via Cristina Poiata from Z Creative Labs looks at 70 years of movement and urban population growth in over 1,800 cities worldwide. Where is the action?
Out of the Farms and Into the Cities
The United Nations cites two intertwined reasons for urbanization: an overall population increase that’s unevenly distributed by region, and an upward trend in people flocking to cities.
Since 1950, the world’s urban population has risen almost six-fold, from 751 million to 4.2 billion in 2018. In North America alone, significant urban growth can be observed in the video for Mexico and the East Coast of the United States as this shift takes place.
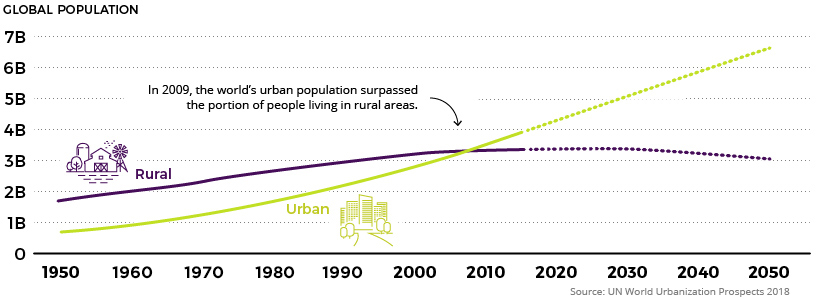
Over the next few decades, the rural population is expected to plateau and eventually decline, while urban growth will continue to shoot up to six billion people and beyond.
The Biggest Urban Hot-Spots
Urban growth is going to happen all across the board.
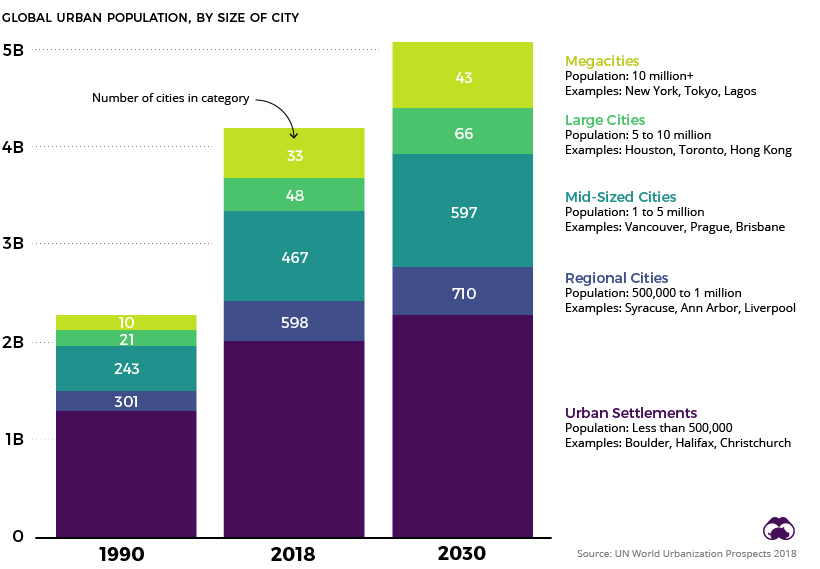
Rapidly rising populations in megacities and major cities will be significant contributors, but it’s also worth noting that the number of regional to mid-sized cities (500k to 5 million inhabitants) will swell drastically by 2030, becoming more influential economic hubs in the process.
Interestingly, it’s mainly cities across Asia and Africa — some of which Westerners are largely unfamiliar with — that may soon wield enormous influence on the global stage.
It’s expected that over a third of the projected urban growth between now and 2050 will occur in just three countries: India, China, and Nigeria. By 2050, it is projected that India could add 416 million urban dwellers, China 255 million, and Nigeria 189 million.
Urbanization and its Complications
Rapid urbanization isn’t only linked to an inevitable rise in city populations.
Some megacities are actually experiencing population contractions, in part due to the effects of low fertility rates in Asia and Europe. For example, while the Greater Tokyo area contains almost 38 million people today, it’s expected to shrink starting in 2020.
As rapid urbanization continues to shape the global economy, finding ways to provide the right infrastructure and services in cities will be a crucial problem to solve for communities and organizations around the world. How we deal with these issues — or how we don’t — will set the stage for the next act in the modern economic era.


Demographics
The Countries That Have Become Sadder Since 2010
Tracking Gallup survey data for more than a decade reveals some countries are witnessing big happiness declines, reflecting their shifting socio-economic conditions.


The Countries That Have Become Sadder Since 2010
This was originally posted on our Voronoi app. Download the app for free on iOS or Android and discover incredible data-driven charts from a variety of trusted sources.
Can happiness be quantified?
Some approaches that try to answer this question make a distinction between two differing components of happiness: a daily experience part, and a more general life evaluation (which includes how people think about their life as a whole).
The World Happiness Report—first launched in 2012—has been making a serious go at quantifying happiness, by examining Gallup poll data that asks respondents in nearly every country to evaluate their life on a 0–10 scale. From this they extrapolate a single “happiness score” out of 10 to compare how happy (or unhappy) countries are.
More than a decade later, the 2024 World Happiness Report continues the mission. Its latest findings also include how some countries have become sadder in the intervening years.
Which Countries Have Become Unhappier Since 2010?
Afghanistan is the unhappiest country in the world right now, and is also 60% unhappier than over a decade ago, indicating how much life has worsened since 2010.
In 2021, the Taliban officially returned to power in Afghanistan, after nearly two decades of American occupation in the country. The Islamic fundamentalist group has made life harder, especially for women, who are restricted from pursuing higher education, travel, and work.
On a broader scale, the Afghan economy has suffered post-Taliban takeover, with various consequent effects: mass unemployment, a drop in income, malnutrition, and a crumbling healthcare system.
| Rank | Country | Happiness Score Loss (2010–24) | 2024 Happiness Score (out of 10) |
|---|---|---|---|
| 1 | 🇦🇫 Afghanistan | -2.6 | 1.7 |
| 2 | 🇱🇧 Lebanon | -2.3 | 2.7 |
| 3 | 🇯🇴 Jordan | -1.5 | 4.2 |
| 4 | 🇻🇪 Venezuela | -1.3 | 5.6 |
| 5 | 🇲🇼 Malawi | -1.2 | 3.4 |
| 6 | 🇿🇲 Zambia | -1.2 | 3.5 |
| 7 | 🇧🇼 Botswana | -1.2 | 3.4 |
| 8 | 🇾🇪 Yemen | -1.0 | 3.6 |
| 9 | 🇪🇬 Egypt | -1.0 | 4.0 |
| 10 | 🇮🇳 India | -0.9 | 4.1 |
| 11 | 🇧🇩 Bangladesh | -0.9 | 3.9 |
| 12 | 🇨🇩 DRC | -0.7 | 3.3 |
| 13 | 🇹🇳 Tunisia | -0.7 | 4.4 |
| 14 | 🇨🇦 Canada | -0.6 | 6.9 |
| 15 | 🇺🇸 U.S. | -0.6 | 6.7 |
| 16 | 🇨🇴 Colombia | -0.5 | 5.7 |
| 17 | 🇵🇦 Panama | -0.5 | 6.4 |
| 18 | 🇵🇰 Pakistan | -0.5 | 4.7 |
| 19 | 🇿🇼 Zimbabwe | -0.5 | 3.3 |
| 20 | 🇮🇪 Ireland | -0.5 | 6.8 |
| N/A | 🌍 World | +0.1 | 5.5 |
Nine countries in total saw their happiness score drop by a full point or more, on the 0–10 scale.
Noticeably, many of them have seen years of social and economic upheaval. Lebanon, for example, has been grappling with decades of corruption, and a severe liquidity crisis since 2019 that has resulted in a banking system collapse, sending poverty levels skyrocketing.
In Jordan, unprecedented population growth—from refugees leaving Iraq and Syria—has aggravated unemployment rates. A somewhat abrupt change in the line of succession has also raised concerns about political stability in the country.

-

 Culture1 week ago
The Highest Earning Athletes in Seven Professional Sports
-

 Countries2 weeks ago
Population Projections: The World’s 6 Largest Countries in 2075
-

 Markets2 weeks ago
The Top 10 States by Real GDP Growth in 2023
-

 Demographics2 weeks ago
The Smallest Gender Wage Gaps in OECD Countries
-

 United States2 weeks ago
Where U.S. Inflation Hit the Hardest in March 2024
-

 Green2 weeks ago
Top Countries By Forest Growth Since 2001
-

 United States2 weeks ago
Ranked: The Largest U.S. Corporations by Number of Employees
-

 Maps2 weeks ago
The Largest Earthquakes in the New York Area (1970-2024)