Healthcare
Visualizing Over A Century of Global Fertility
var divElement = document.getElementById(‘viz1565218803576’); var vizElement = divElement.getElementsByTagName(‘object’)[0]; if ( divElement.offsetWidth > 800 ) { vizElement.style.width=’1000px’;vizElement.style.height=’2927px’;} else if ( divElement.offsetWidth > 500 ) { vizElement.style.width=’1000px’;vizElement.style.height=’2927px’;} else { vizElement.style.width=’1000px’;vizElement.style.height=’2927px’;} var scriptElement = document.createElement(‘script’); scriptElement.src = ‘https://public.tableau.com/javascripts/api/viz_v1.js’; vizElement.parentNode.insertBefore(scriptElement, vizElement);
Visualizing Over A Century of World Fertility
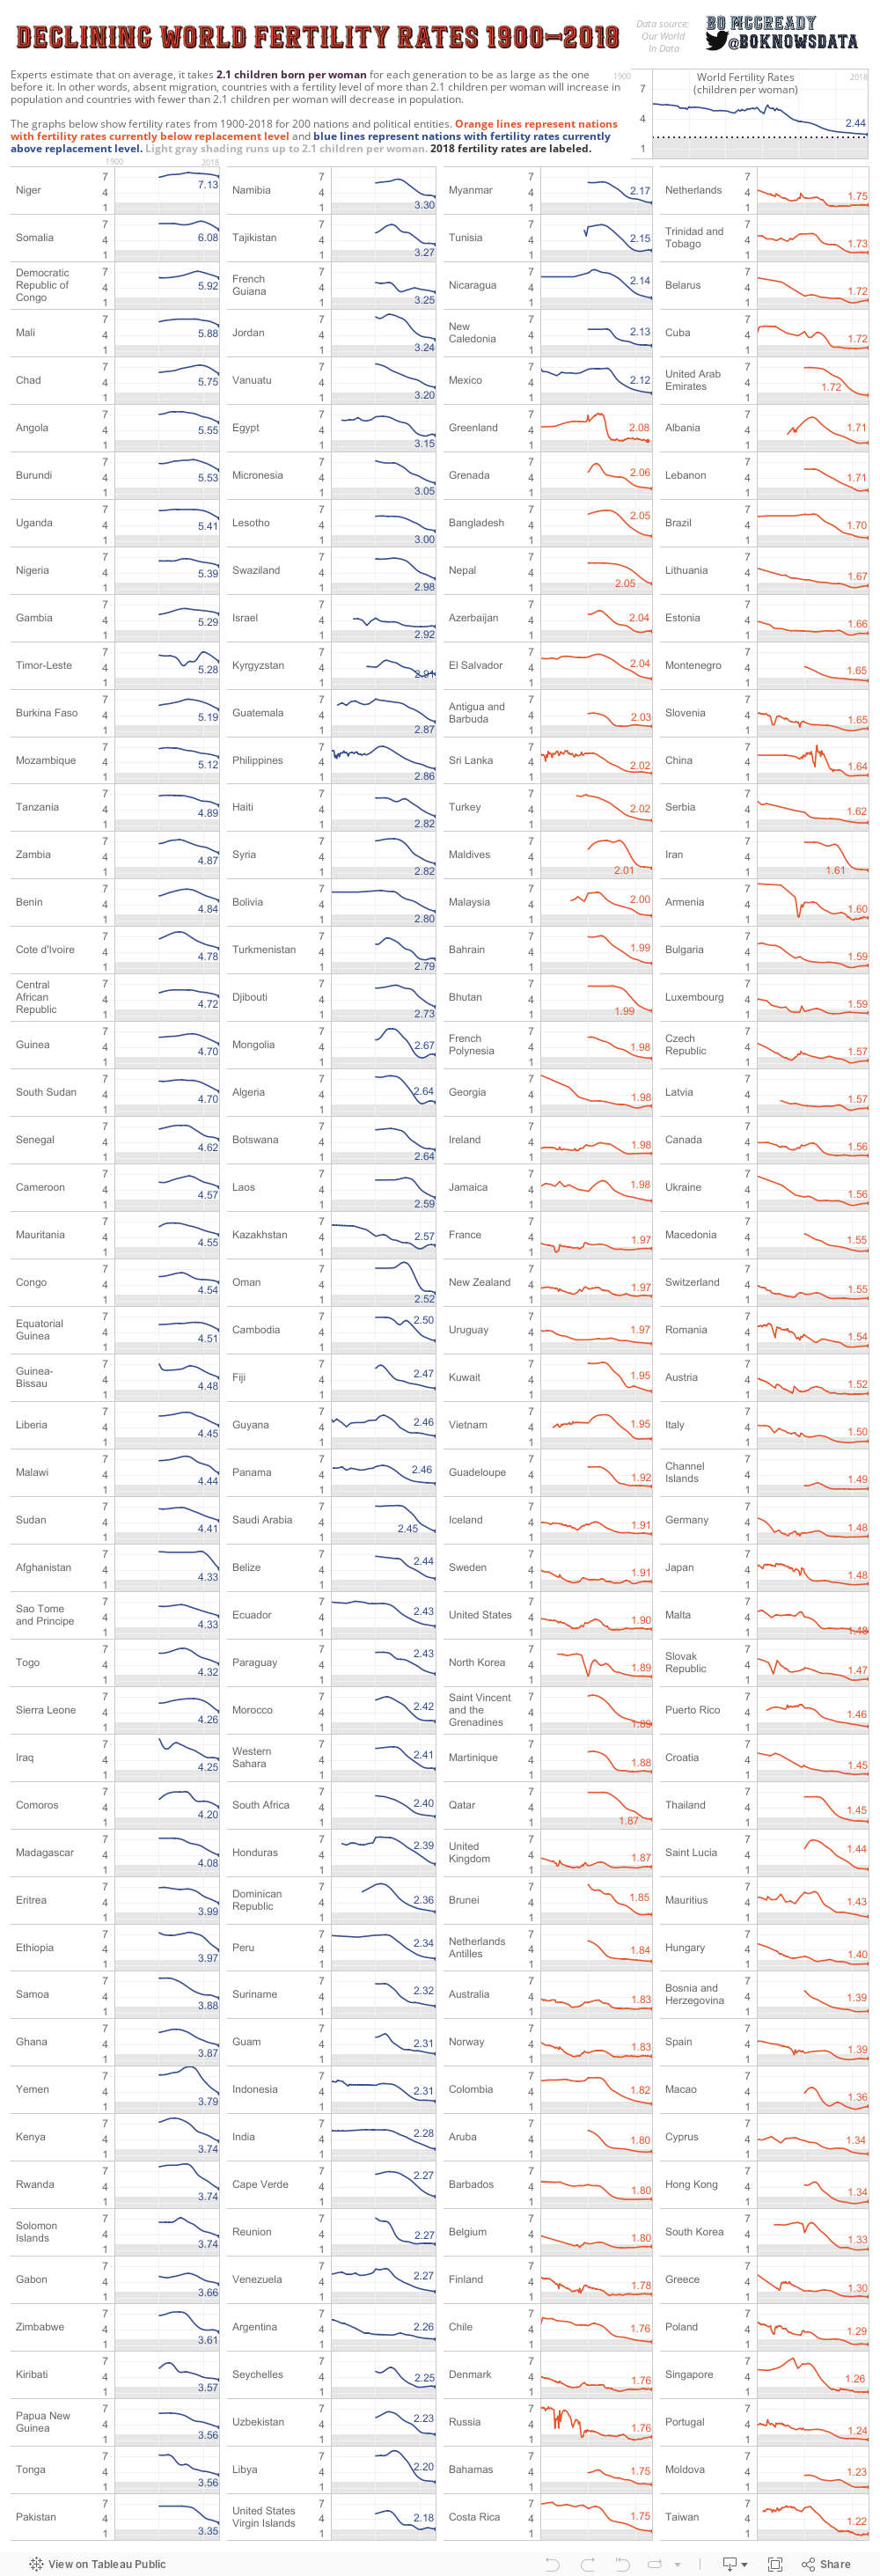
In just 50 years, world fertility rates have been cut in half.
This sea change can be attributed to multiple factors, ranging from medical advances to greater gender equity. But generally speaking, as more women gain an education and enter the workforce, they’re delaying motherhood and often having fewer children in the process.
Today’s interactive data visualization was put together by Bo McCready, the Director of Analytics at KIPP Texas. Using numbers from Our World in Data, it depicts the changes in the world’s fertility rate—the average number of children per woman—spanning from the beginning of the 20th century to present day.
A Demographic Decline
The global fertility rate fell from 5.25 children per woman in 1900, to 2.44 children per woman in 2018. The steepest drop in this shift happened in a single decade, from 1970 to 1980.
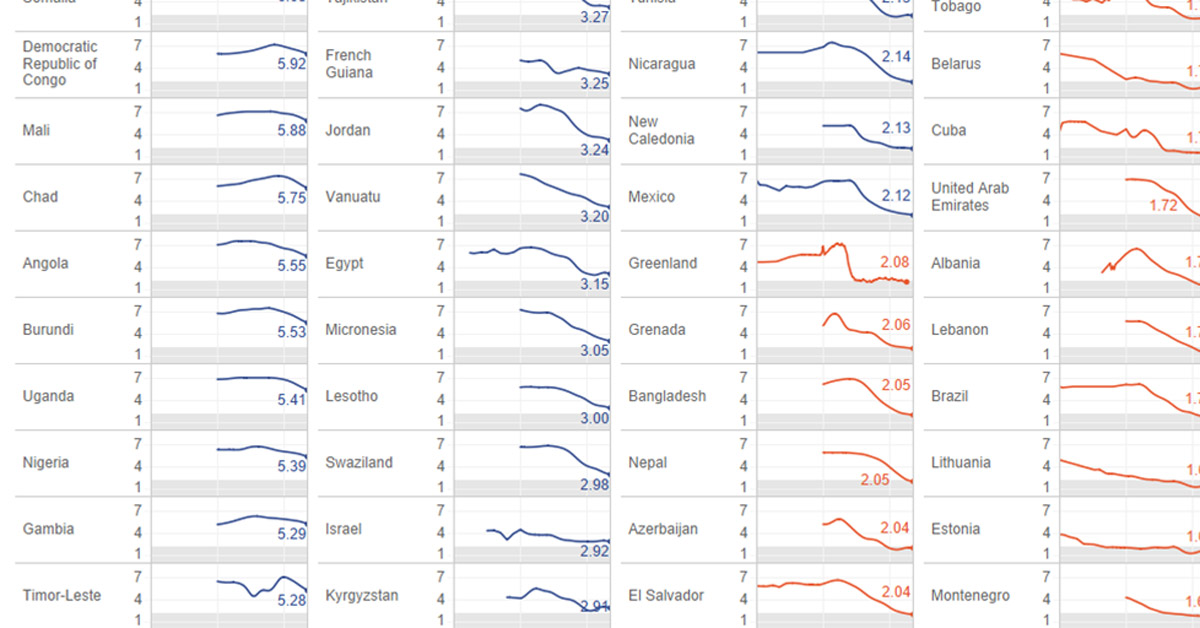
In the interactive graphic, you’ll see graphs for 200 different countries and political entities showing their total fertility rate (FTR) over time. Here’s a quick summary of the countries with the highest and lowest FTRs, as of 2017:
| Top 10 Countries | Fertility rate | Bottom 10 Countries | Fertility Rate |
|---|---|---|---|
| 🇳🇪 Niger | 7.13 | 🇹🇼 Taiwan | 1.22 |
| 🇸🇴 Somalia | 6.08 | 🇲🇩 Moldova | 1.23 |
| 🇨🇩 Democratic Republic of Congo | 5.92 | 🇵🇹 Portugal | 1.24 |
| 🇲🇱 Mali | 5.88 | 🇸🇬 Singapore | 1.26 |
| 🇹🇩 Chad | 5.75 | 🇵🇱 Poland | 1.29 |
| 🇦🇴 Angola | 5.55 | 🇬🇷 Greece | 1.3 |
| 🇧🇮 Burundi | 5.53 | 🇰🇷 South Korea | 1.33 |
| 🇺🇬 Uganda | 5.41 | 🇭🇰 Hong Kong | 1.34 |
| 🇳🇬 Nigeria | 5.39 | 🇨🇾 Cyprus | 1.34 |
| 🇬🇲 Gambia | 5.29 | 🇲🇴 Macao | 1.36 |
At a glance, the countries with the highest fertility are all located in Africa, while several Asian countries end up in the lowest fertility list.
The notable decade of decline in average global fertility can be partially traced back to the actions of the demographic giants China and India. In the 1970s, China’s controversial “one child only” policy and India’s state-led sterilization campaigns caused sharp declines in births for both countries. Though they hold over a quarter of the world’s population today, the effects of these government decisions are still being felt.
Population Plateau, or Cliff?
The overall decline in fertility rates isn’t expected to end anytime soon, and it’s even expected to fall past 2.1 children per woman, which is known as the “replacement rate”. Any fertility below this rate signals fewer new babies than parents, leading to an eventual population decline.
Experts predict that world fertility will further drop from 2.5 to 1.9 children per woman by 2100. This means that global population growth will slow down or possibly even go negative.
Africa will continue to be the only region with significant growth—consistent with the generous fertility rates of Nigeria, the DRC, and Angola. In fact, the continent is expected to house 13 of the world’s largest megacities, as its population expands from 1.3 billion to 4.3 billion by 2100.


Healthcare
The Cost of an EpiPen in Major Markets
This visualization compares EpiPen prices around the world, with the U.S. having the highest prices by far.


The Cost of an EpiPen in Major Markets
This was originally posted on our Voronoi app. Download the app for free on iOS or Android and discover incredible data-driven charts from a variety of trusted sources.
EpiPens are auto-injectors containing epinephrine, a drug that can treat or reverse severe allergic reactions, potentially preventing death.
The global epinephrine market was valued at $1.75 billion in 2022 and is projected to reach $4.08 billion by 2030. North America represents over 60% of the market.
EpiPens, however, can be prohibitively expensive in some regions.
In this graphic, we present estimated EpiPen prices in major global markets, compiled by World Population Review and converted to U.S. dollars as of August 2023.
Why are U.S. Prices so High?
The U.S. stands out as the most expensive market for EpiPens, despite over 1 million Americans having epinephrine prescriptions. After Mylan (now part of Pfizer) acquired the rights to produce EpiPens in the U.S. in 2007, the cost of a two-pack skyrocketed to $600, up from about $60.
| Country | Price (USD) |
|---|---|
| 🇺🇸 U.S. | 300* |
| 🇯🇵 Japan | 98 |
| 🇩🇪 Germany | 85 |
| 🇨🇦 Canada | 80 |
| 🇫🇷 France | 76 |
| 🇦🇺 Australia | 66 |
| 🇬🇧 UK | 61 |
| 🇮🇳 India | 30 |
*Per unit cost. Commonly sold as a two-pack, meaning total cost is equal to $600
Former Mylan CEO Heather Bresch defended the price hikes to Congress, citing minimal profit margins. Mylan eventually settled with the U.S. government for a nine-figure sum.
Notably, EpiPens are available at a fraction of the cost in other developed countries like Japan, Germany, and Canada.
Making EpiPens More Affordable
Efforts to improve EpiPen affordability are underway in several U.S. states. For instance, the Colorado House approved a $60 price cap on epinephrine, now under review by the state Senate.
Similar measures in Rhode Island, Delaware, Missouri, and Vermont aim to ensure insurance coverage for epinephrine, which is not currently mandatory, although most health plans cover it.

-

 Debt1 week ago
How Debt-to-GDP Ratios Have Changed Since 2000
-

 Demographics2 weeks ago
Population Projections: The World’s 6 Largest Countries in 2075
-

 Markets2 weeks ago
The Top 10 States by Real GDP Growth in 2023
-

 Demographics2 weeks ago
The Smallest Gender Wage Gaps in OECD Countries
-

 Economy2 weeks ago
Where U.S. Inflation Hit the Hardest in March 2024
-

 Green2 weeks ago
Top Countries By Forest Growth Since 2001
-

 United States2 weeks ago
Ranked: The Largest U.S. Corporations by Number of Employees
-

 Maps2 weeks ago
The Largest Earthquakes in the New York Area (1970-2024)