Healthcare
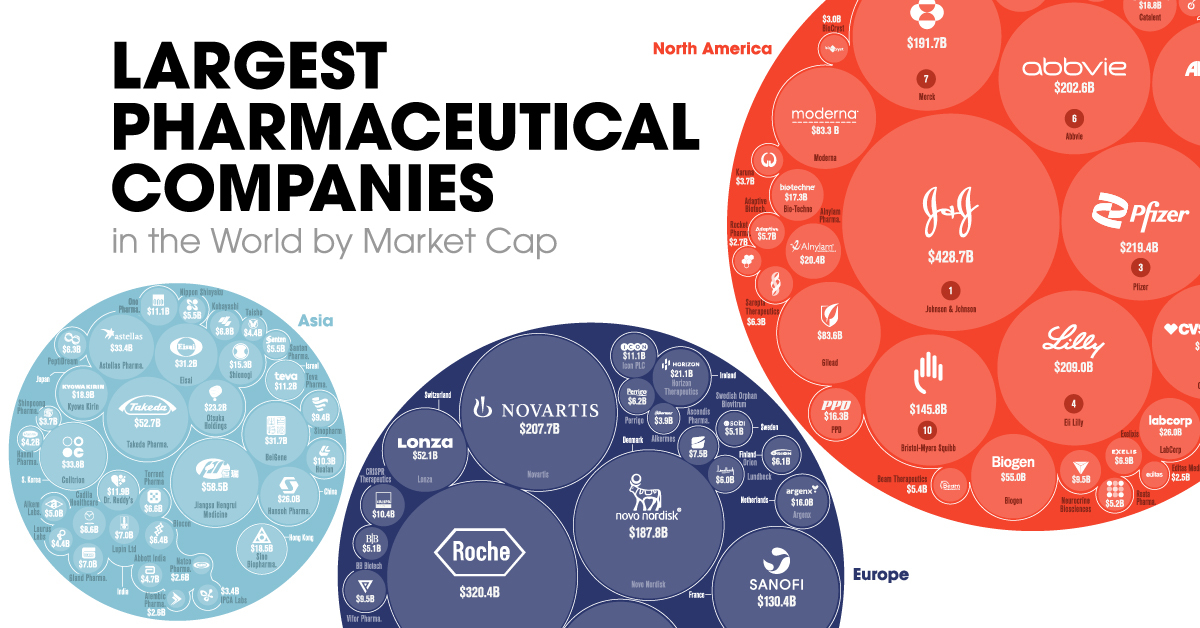
Visualizing the World’s Biggest Pharmaceutical Companies


Who are the World’s Biggest Pharmaceutical Companies?
Some of the world’s biggest pharmaceutical companies have played a central role in the COVID-19 pandemic.
However, it’s likely no surprise that the pandemic has also been great for many healthcare businesses. In fact, in 2020 alone, the world’s 50 largest pharmaceutical companies still combined for a whopping $851 billion in revenues.
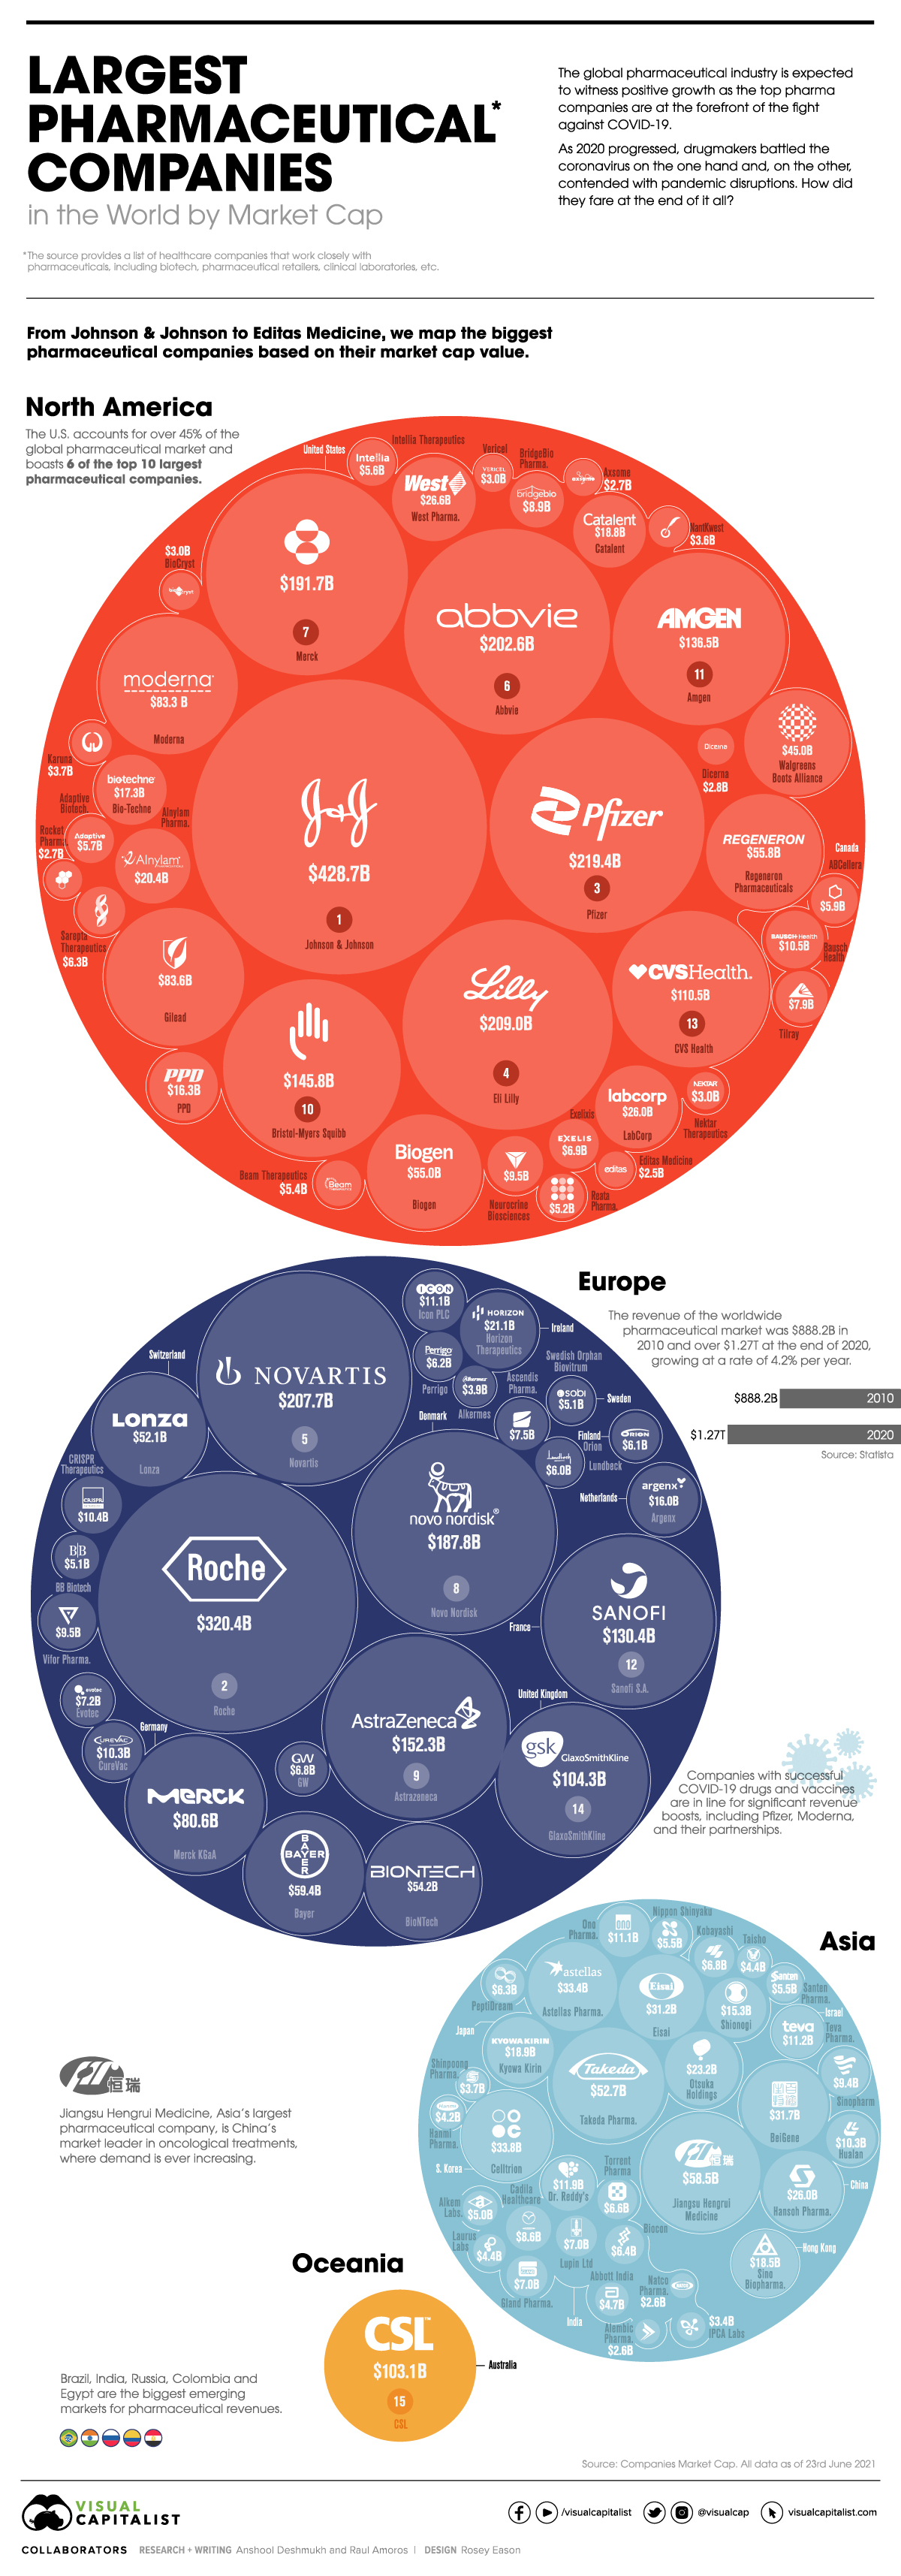
In this graphic, using data from Companies Market Cap, we list the largest pharmaceutical companies in the world by market capitalization. It’s worth noting this list also includes healthcare companies that work closely with pharmaceuticals, including biotech, pharmaceutical retailers, clinical laboratories, etc.
Editor’s Note: A previous version of this graphic was missing some key companies such as GSK and AbbVie. They were unfortunately not included in the original source and we are now working to make sure there were no other smaller omissions. Thanks to all that sent in corrections.
The Pharmaceutical Leaders
To start, here are the top five biggest pharmaceutical companies in the world at the moment by market capitalization:
1. Johnson & Johnson
The pharmaceutical and consumer goods giant is worth $428.7 billion in market cap. They developed the third vaccine authorized for use in the U.S. and were named among the TIME100 Most Influential Companies List in 2021.
2. Roche
The Swiss pharmaceutical giant is at the forefront of oncology, immunology, infectious diseases, ophthalmology, and neuroscience. In 2019, Roche’s pharma segment sales rose by a healthy 16% to $53 billion.
3. Pfizer
Despite being the leading COVID-19 vaccine manufacturer in North America, Pfizer slid in the rankings to third place. The company has recently gained momentum, especially in the past quarter, with Q2’2021 revenues of $19.0 billion, reflecting a 86% operational growth from 2020.
4. Eli Lilly
Eli Lilly has taken a significant step towards establishing itself as a pharmaceutical industry leader. Having a market cap value of $125 billion in 2019, Eli Lilly has jumped to a current value of $214.9 billion, a significant growth of 72%.
5. Novartis
The second-biggest pharmaceutical company out of Switzerland, Novartis has been the face of the pharma industry for about 25 years. The primary manufacturer for the most recognizable drugs on the market pulled in a revenue of over $48 billion in 2020, a 3% increase compared to 2019.
Here’s how all the biggest pharmaceutical companies in the world stack up against each other:
| Company Rank | Company Name | Market Cap Value | Country |
|---|---|---|---|
| 1 | Johnson & Johnson JNJ | $428.66 B | 🇺🇸 USA |
| 2 | Roche RHHBY | $320.41 B | 🇨🇭 Switzerland |
| 3 | Pfizer PFE | $219.39 B | 🇺🇸 USA |
| 4 | Eli Lilly LLY | $208.99 B | 🇺🇸 USA |
| 5 | Novartis NVS | $207.70 B | 🇨🇭 Switzerland |
| 6 | AbbVie ABBV | $202.60 B | 🇺🇸 USA |
| 7 | Merck MRK | $191.67 B | 🇺🇸 USA |
| 8 | Novo Nordisk NVO | $187.83 B | 🇩🇰 Denmark |
| 9 | Astrazeneca AZN | $152.28 B | 🇬🇧 UK |
| 10 | Bristol-Myers Squibb BMY | $145.80 B | 🇺🇸 USA |
| 11 | Amgen AMGN | $136.50 B | 🇺🇸 USA |
| 12 | Sanofi SNY | $130.37 B | 🇫🇷 France |
| 13 | CVS Health CVS | $110.49 B | 🇺🇸 USA |
| 14 | GlaxoSmithKline GSK | $104.30 B | 🇬🇧 UK |
| 15 | CSL CSL.AX | $103.10 B | 🇦🇺 Australia |
| 16 | Gilead Sciences GILD | $83.62 B | 🇺🇸 USA |
| 17 | Moderna MRNA | $83.25 B | 🇺🇸 USA |
| 18 | Merck KGaA MRK.DE | $80.61 B | 🇩🇪 Germany |
| 19 | Bayer BAYZF | $59.43 B | 🇩🇪 Germany |
| 20 | Jiangsu Hengrui Medicine 600276.SS | $58.51 B | 🇨🇳 China |
| 21 | Regeneron Pharmaceuticals REGN | $55.83 B | 🇺🇸 USA |
| 22 | Biogen BIIB | $55.00 B | 🇺🇸 USA |
| 23 | BioNTech BNTX | $54.23 B | 🇩🇪 Germany |
| 24 | Takeda Pharmaceutical TAK | $52.67 B | 🇯🇵 Japan |
| 25 | Lonza LONN.SW | $52.16 B | 🇨🇭 Switzerland |
| 26 | Walgreens Boots Alliance WBA | $45.05 B | 🇺🇸 USA |
| 27 | Celltrion 068270.KS | $33.80 B | 🇰🇷 S. Korea |
| 28 | Astellas Pharma ALPMF | $33.42 B | 🇯🇵 Japan |
| 29 | BeiGene BGNE | $31.65 B | 🇨🇳 China |
| 30 | Eisai 4523.T | $31.20 B | 🇯🇵 Japan |
| 31 | West Pharma WST | $26.59 B | 🇺🇸 USA |
| 32 | Hansoh Pharma 3692.HK | $26.00 B | 🇨🇳 China |
| 33 | LabCorp LH | $25.97 B | 🇺🇸 USA |
| 34 | Otsuka Holdings 4578.T | $23.15 B | 🇯🇵 Japan |
| 35 | Horizon Therapeutics HZNP | $21.13 B | 🇮🇪 Ireland |
| 36 | Alnylam Pharmaceuticals ALNY | $20.42 B | 🇺🇸 USA |
| 37 | kyowa Kirin 4151.T | $18.85 B | 🇯🇵 Japan |
| 38 | Catalent CTLT | $18.74 B | 🇺🇸 USA |
| 39 | Sino Biopharmaceutical 1177.HK | $18.48 B | 🇭🇰 Hong Kong |
| 40 | Bio-Techne TECH | $17.25 B | 🇺🇸 USA |
| 41 | PPD PPD | $16.26 B | 🇺🇸 USA |
| 42 | Argenx ARGX | $16.03 B | 🇳🇱 Netherlands |
| 43 | Shionogi 4507.T | $15.29 B | 🇯🇵 Japan |
| 44 | Dr. Reddy's RDY | $11.88 B | 🇮🇳 India |
| 45 | Teva Pharmaceutical Industries TEVA | $11.21 B | 🇮🇱 Israel |
| 46 | Ono Pharmaceutical 4528.T | $11.12 B | 🇯🇵 Japan |
| 47 | ICON plc ICLR | $11.09 B | 🇮🇪 Ireland |
| 48 | Bausch Health BHC | $10.47 B | 🇨🇦 Canada |
| 49 | CRISPR Therapeutics CRSP | $10.42 B | 🇨🇭 Switzerland |
| 50 | Curevac CVAC | $10.33 B | 🇩🇪 Germany |
| 51 | Hualan Biological Engineering 002007.SZ | $10.31 B | 🇨🇳 China |
| 52 | Vifor Pharma VIFN.SW | $9.49 B | 🇨🇭 Switzerland |
| 53 | Neurocrine Biosciences NBIX | $9.45 B | 🇺🇸 USA |
| 54 | Sinopharm 1099.HK | $9.42 B | 🇨🇳 China |
| 55 | BridgeBio Pharma BBIO | $8.89 B | 🇺🇸 USA |
| 56 | Cadila Healthcare CADILAHC.NS | $8.59 B | 🇮🇳 India |
| 57 | Sumitomo Dainippon Pharma 4506.T | $8.16 B | 🇯🇵 Japan |
| 58 | Tilray TLRY | $7.89 B | 🇨🇦 Canada |
| 59 | Ascendis Pharma ASND | $7.51 B | 🇩🇰 Denmark |
| 60 | Evotec EVT.F | $7.19 B | 🇩🇪 Germany |
| 61 | Lupin Limited LUPIN.NS | $7.04 B | 🇮🇳 India |
| 62 | Gland Pharma GLAND.NS | $7.01 B | 🇮🇳 India |
| 63 | Exelixis EXEL | $6.95 B | 🇺🇸 USA |
| 64 | GW Pharmaceuticals GWPH | $6.81 B | 🇬🇧 UK |
| 65 | KOBAYASHI Pharmaceutical 4967.T | $6.78 B | 🇯🇵 Japan |
| 66 | Torrent Pharmaceuticals TORNTPHARM.NS | $6.61 B | 🇮🇳 India |
| 67 | Biocon BIOCON.NS | $6.43 B | 🇮🇳 India |
| 68 | PeptiDream 4587.T | $6.32 B | 🇯🇵 Japan |
| 69 | Sarepta Therapeutics SRPT | $6.25 B | 🇺🇸 USA |
| 70 | Perrigo PRGO | $6.21 B | 🇮🇪 Ireland |
| 71 | Orion Corporation ORNAV.HE | $6.11 B | 🇫🇮 Finland |
| 72 | Lundbeck LDB.F | $6.04 B | 🇩🇰 Denmark |
| 73 | AbCellera ABCL | $5.87 B | 🇨🇦 Canada |
| 74 | Adaptive Biotechnologies ADPT | $5.69 B | 🇺🇸 USA |
| 75 | Intellia Therapeutics NTLA | $5.62 B | 🇺🇸 USA |
| 76 | Santen Pharmaceutical 4536.T | $5.49 B | 🇯🇵 Japan |
| 77 | Nippon Shinyaku 4516.T | $5.46 B | 🇯🇵 Japan |
| 78 | Beam Therapeutics BEAM | $5.43 B | 🇺🇸 USA |
| 79 | Reata Pharmaceuticals RETA | $5.15 B | 🇺🇸 USA |
| 80 | Swedish Orphan Biovitrum SOBI.ST | $5.13 B | 🇸🇪 Sweden |
| 81 | BB Biotech BION.SW | $5.08 B | 🇨🇭 Switzerland |
| 82 | Alkem Laboratories ALKEM.NS | $5.00 B | 🇮🇳 India |
| 83 | Abbott India ABBOTINDIA.NS | $4.69 B | 🇮🇳 India |
| 84 | Laurus Labs LAURUSLABS.NS | $4.44 B | 🇮🇳 India |
| 85 | Taisho Pharmaceutical 4581.T | $4.39 B | 🇯🇵 Japan |
| 86 | Hanmi Pharmaceutical 008930.KS | $4.22 B | 🇰🇷 S. Korea |
| 87 | Alkermes ALKS | $3.87 B | 🇮🇪 Ireland |
| 88 | Karuna Therapeutics KRTX | $3.71 B | 🇺🇸 USA |
| 89 | Shinpoong Pharm 019170.KS | $3.65 B | 🇰🇷 S. Korea |
| 90 | NantKwest NK | $3.55 B | 🇺🇸 USA |
| 91 | Ipca Laboratories IPCALAB.NS | $3.41 B | 🇮🇳 India |
| 92 | Nektar Therapeutics NKTR | $3.02 B | 🇺🇸 USA |
| 93 | BioCryst Pharmaceuticals BCRX | $3.01 B | 🇺🇸 USA |
| 94 | Vericel VCEL | $2.96 B | 🇺🇸 USA |
| 95 | Dicerna Pharmaceuticals DRNA | $2.84 B | 🇺🇸 USA |
| 96 | Rocket Pharmaceuticals RCKT | $2.74 B | 🇺🇸 USA |
| 97 | Axsome Therapeutics AXSM | $2.65 B | 🇺🇸 USA |
| 98 | Natco Pharma NATCOPHARM.NS | $2.63 B | 🇮🇳 India |
| 99 | Alembic Pharmaceuticals APLLTD.NS | $2.59 B | 🇮🇳 India |
| 100 | Editas Medicine EDIT | $2.54 B | 🇺🇸 USA |
World’s Largest Pharmaceutical Exporters and Importers
According to the World Trade Organization (WTO), these countries exported the most number of pharmaceuticals in the year 2019:
| Rank | Country | Export Value (US$B) |
|---|---|---|
| 1 | 🇩🇪 Germany | $91.4 |
| 2 | 🇨🇭 Switzerland | $84.8 |
| 3 | 🇺🇸 U.S. | $55.7 |
| 4 | 🇧🇪 Belgium | $55.7 |
| 5 | 🇮🇪 Ireland | $55.4 |
In contrast, here are the biggest importers over the same period.
| Rank | Country | Import Value (US$B) |
|---|---|---|
| 1 | 🇺🇸 U.S. | $132.4 |
| 2 | 🇩🇪 Germany | $59.4 |
| 3 | 🇧🇪 Belgium | $47.3 |
| 4 | 🇨🇳 China | $35.7 |
| 5 | 🇳🇱 Netherlands | $33.5 |
This position is hardly surprising for the U.S., where six of the world’s top 10 pharmaceutical companies are headquartered. The country also captures 45% of the global market.
The Future of Pharmaceutical Companies
If the response to the COVID-19 pandemic has taught us anything, it is that in building a patient-centered future, the pharmaceutical industry plays a key role. It has to constantly find new ways to customize medicines while researching and developing new tools and drugs.
By embracing disruptive technologies like 3D printed drugs, artificial intelligence guided therapies, and preventive medicine while working with regulatory agencies, the pharmaceutical companies will benefit from having a digital revolution.
Furthermore, emerging markets will have a more significant say in the global pharmaceutical market in the coming years. Even though ‘big pharma’ will keep raking in the massive profits they do every year, their reliance on countries like Brazil and India for research and drug production will significantly impact the years to come.


Healthcare
The Cost of an EpiPen in Major Markets
This visualization compares EpiPen prices around the world, with the U.S. having the highest prices by far.


The Cost of an EpiPen in Major Markets
This was originally posted on our Voronoi app. Download the app for free on iOS or Android and discover incredible data-driven charts from a variety of trusted sources.
EpiPens are auto-injectors containing epinephrine, a drug that can treat or reverse severe allergic reactions, potentially preventing death.
The global epinephrine market was valued at $1.75 billion in 2022 and is projected to reach $4.08 billion by 2030. North America represents over 60% of the market.
EpiPens, however, can be prohibitively expensive in some regions.
In this graphic, we present estimated EpiPen prices in major global markets, compiled by World Population Review and converted to U.S. dollars as of August 2023.
Why are U.S. Prices so High?
The U.S. stands out as the most expensive market for EpiPens, despite over 1 million Americans having epinephrine prescriptions. After Mylan (now part of Pfizer) acquired the rights to produce EpiPens in the U.S. in 2007, the cost of a two-pack skyrocketed to $600, up from about $60.
| Country | Price (USD) |
|---|---|
| 🇺🇸 U.S. | 300* |
| 🇯🇵 Japan | 98 |
| 🇩🇪 Germany | 85 |
| 🇨🇦 Canada | 80 |
| 🇫🇷 France | 76 |
| 🇦🇺 Australia | 66 |
| 🇬🇧 UK | 61 |
| 🇮🇳 India | 30 |
*Per unit cost. Commonly sold as a two-pack, meaning total cost is equal to $600
Former Mylan CEO Heather Bresch defended the price hikes to Congress, citing minimal profit margins. Mylan eventually settled with the U.S. government for a nine-figure sum.
Notably, EpiPens are available at a fraction of the cost in other developed countries like Japan, Germany, and Canada.
Making EpiPens More Affordable
Efforts to improve EpiPen affordability are underway in several U.S. states. For instance, the Colorado House approved a $60 price cap on epinephrine, now under review by the state Senate.
Similar measures in Rhode Island, Delaware, Missouri, and Vermont aim to ensure insurance coverage for epinephrine, which is not currently mandatory, although most health plans cover it.

-

 Education1 week ago
How Hard Is It to Get Into an Ivy League School?
-

 Technology2 weeks ago
Ranked: Semiconductor Companies by Industry Revenue Share
-

 Markets2 weeks ago
Ranked: The World’s Top Flight Routes, by Revenue
-

 Demographics2 weeks ago
Population Projections: The World’s 6 Largest Countries in 2075
-

 Markets2 weeks ago
The Top 10 States by Real GDP Growth in 2023
-

 Demographics2 weeks ago
The Smallest Gender Wage Gaps in OECD Countries
-

 Economy2 weeks ago
Where U.S. Inflation Hit the Hardest in March 2024
-

 Green2 weeks ago
Top Countries By Forest Growth Since 2001