Healthcare
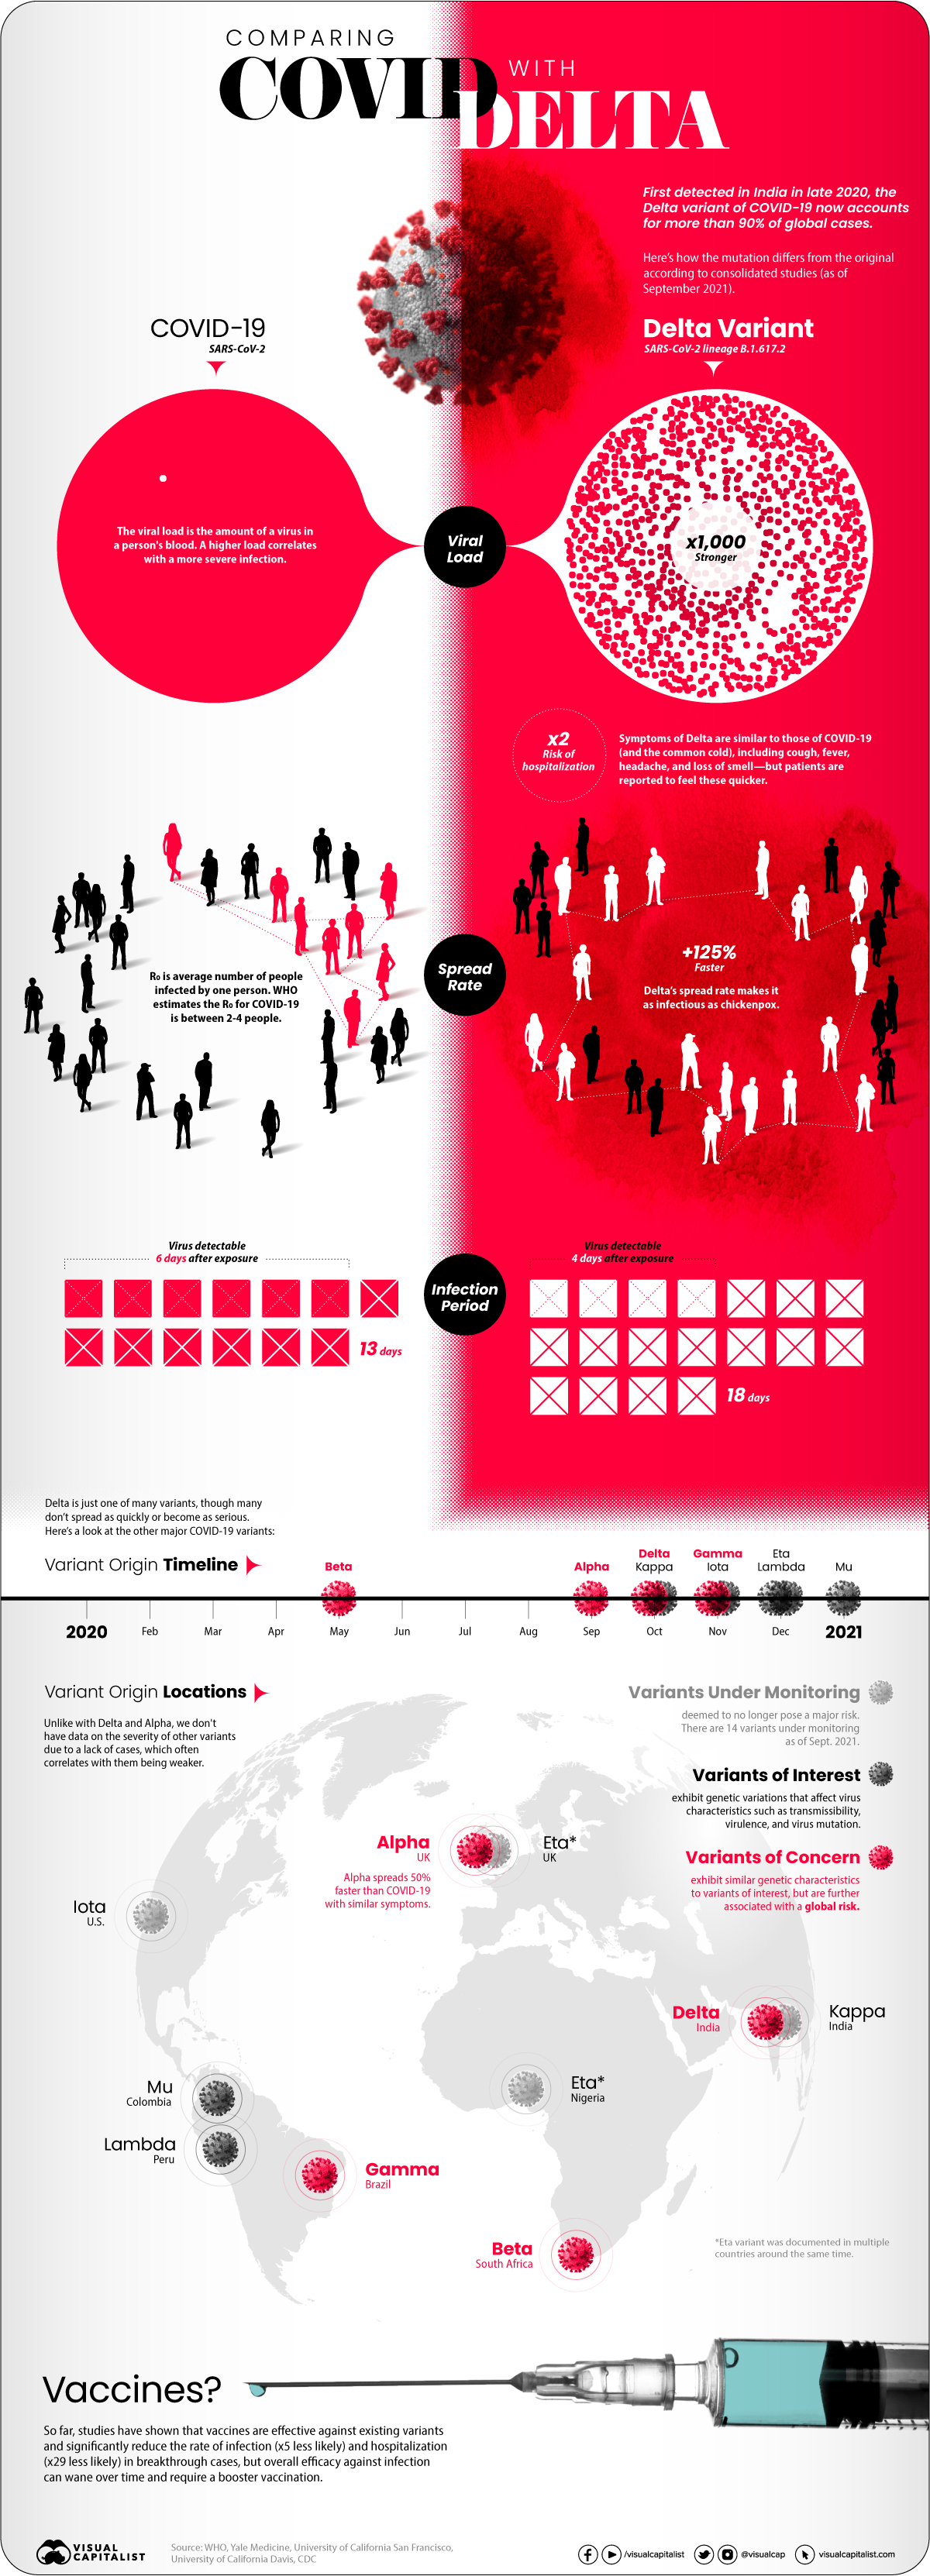
How Does the COVID Delta Variant Compare?
In late 2020, a variant of COVID-19 was detected in India that began to quickly spread.
Soon after it received the label โDelta,โ it started to become the predominant strain of COVID-19 in countries of transmission. It spread faster than both the original disease and other variants, including โAlphaโ that had taken hold in the UK.
Now the COVID-19 pandemic has essentially become the Delta pandemic, as the variant accounts for more than 90% of global cases.
But how does the COVID-19 Delta variant differ from the original disease? We consolidated studies as of September 2021 to highlight key differences between COVID-19 and the dominant variant. Sources include the CDC, Yale Medicine, and the University of California.
COVID-19 vs COVID-19 Delta Variant
At first glance, infections caused by the Delta variant are similar to the original COVID-19 disease. Symptoms reported from patients include cough, fever, headache, and a loss of smell.
But studies showed that the difference was in how quickly and severely patients got sick:
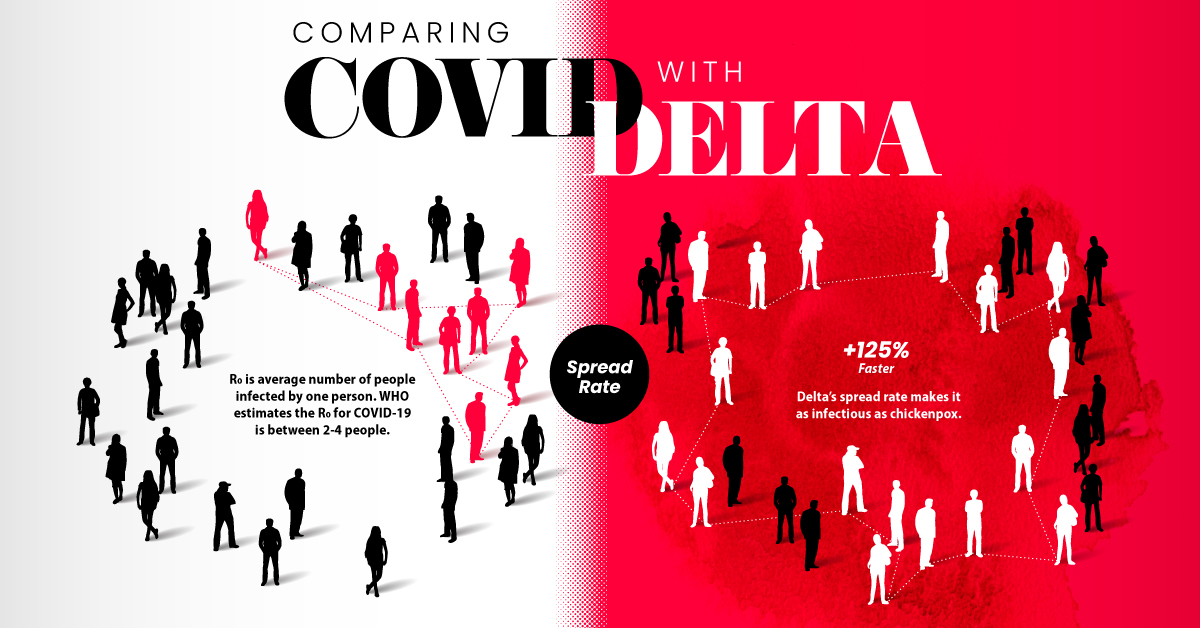
- Spread rate: How quickly the infection spreads in a community (based on the R0 or basic reproductive number). The Delta variant spread 125% faster than the original disease, making it potentially as infectious as chickenpox.
- Viral load: How much of a virus is detectable in an infected personโs blood, with higher loads correlating with more severe infections. Delta infections had a 1000x higher viral load.
- Virus detectable: How long after exposure a virus is detectable in an infected personโs blood. Delta infections were found to be detectable four days after exposure, faster than the original disease (six days).
- Infectious period: How long an infected person has the capability to pass on the virus to other people, from the first time they were exposed. Delta infections were contagious for longer than traditional COVID-19 infections, at 18 days compared to 13 days.
- Risk of hospitalization: How much more or less likely is an infection going to require hospitalization for treatment? Infections caused by the Delta variant were twice as likely to cause hospitalization compared to the original disease.
One other important finding from studies was that the existing COVID-19 vaccines helped against Delta infections.
The CDC found that approved vaccines reduced the rate of infection by 5x and the rate of hospitalization by 29x in a breakthrough case. They also found that overall efficacy against infection can wane over time, however, and at-risk people might require a booster vaccine.
What About Other COVID-19 Variants?
Delta is just one of many COVID-19 variants tracked by health officials, but itโs the one we know the most about.
Thatโs because reliable statistics and information on diseases requires thousands of cases for comparisons. We know a lot about Delta (and the once-dominant UK strain Alpha) because of how widespread they became, but there havenโt been enough cases of other variants to reliably assess differences.
As of September 2021, WHO was tracking 20 COVID-19 variants around the world with different classifications based on potential severity:
- 14 Variants under monitoring (VUM): Variants that are deemed to not pose a major global health risk, or no longer pose one.
- 2 Variants of Interest (VOI): Variants that affect transmissibility, virulence, mutation, and other virus characteristics, and are spreading in clusters.
- 4 Variants of Concern (VOC): Have similar characteristics to VOI but are further associated with a global risk.
Most of the current variants of interest and concern were first identified and labeled in late 2020, though 2021 variants are showing up as well.
Label | Designation | Documented Origin | Earliest Identified Date |
---|---|---|---|
Alpha | Variant of Concern | UK | September 2020 |
Beta | Variant of Concern | South Africa | May 2020 |
Gamma | Variant of Concern | Brazil | November 2020 |
Delta | Variant of Concern | India | October 2020 |
Lambda | Variant of Interest | Peru | December 2020 |
Mu | Variant of Interest | Colombia | January 2021 |
Should you be worried about all of these variants? For the most part, a lack of cases to provide clear information also reflects that theyโre equivalent to or weaker than traditional COVID-19 infections.
But itโs important to note that our understanding of diseases and variants becomes more nuanced and accurate over time. As research continues over a longer timeline and over a wider database of cases, expect information on COVID-19 variants (and any disease) to become more concrete.
Countries
Charted: The Worldโs Aging Population from 1950 to 2100
This graphic visualizes the worldโs aging population, showing data for every country and territory around the world.

Charted: The Worldโs Aging Population from 1950 to 2100
As demographics continue to shift in the 21st century, the worldโs aging population will continue to be a focal point for many global decision makers.
Most countries around the world have experienced population explosions, or are about to. Combine this with declining birth rates and falling mortality rates, and it’s clear that the global senior population will continue to reach new heights.
These graphics by Pablo Alvarez use data from the 2022 UN World Population Prospects to visualize this increasing aging population across countries.
The Worldโs Aging Population from 1950 to 2100
In 2022, there were 771 million people aged 65+ years globally, accounting for almost 10% of the world’s population.
This segment has been growing at an increasing rate, and it’s expected to hit 16% in 2050, and eventually 24% by 2100. Here’s what that’s projected to look like, for every country and territory.
Country by Population Aged +65 Years | 1950 | 2022 | 2100 |
---|---|---|---|
๐ฆ๐ซ Afghanistan | 2.85% | 2.39% | 16.03% |
๐ฆ๐ฑ Albania | 6.04% | 16.66% | 49.08% |
๐ฉ๐ฟ Algeria | 3.49% | 6.39% | 28.83% |
๐ฆ๐ธ American Samoa | 2.38% | 7.27% | 45.41% |
๐ฆ๐ฉ Andorra | 10.02% | 14.98% | 37.04% |
๐ฆ๐ด Angola | 2.93% | 2.6% | 12.07% |
๐ฆ๐ฎ Anguilla | 3.69% | 10.71% | 37.49% |
๐ฆ๐ฌ Antigua and Barbuda | 4.14% | 10.63% | 35.4% |
๐ฆ๐ท Argentina | 4.13% | 11.92% | 31.79% |
๐ฆ๐ฒ Armenia | 8.17% | 13.15% | 36.13% |
๐ฆ๐ผ Aruba | 1.77% | 16.15% | 36.51% |
๐ฆ๐บ Australia | 8.17% | 16.9% | 31.38% |
๐ฆ๐น Austria | 10.42% | 19.81% | 33.93% |
๐ฆ๐ฟ Azerbaijan | 6.89% | 7.11% | 30.5% |
๐ง๐ธ Bahamas | 4.76% | 8.89% | 29.58% |
๐ง๐ญ Bahrain | 2.88% | 3.76% | 21.89% |
๐ง๐ฉ Bangladesh | 3.9% | 6.04% | 32.56% |
๐ง๐ง Barbados | 5.24% | 16.28% | 33.19% |
๐ง๐พ Belarus | 8.24% | 17.18% | 30.45% |
๐ง๐ช Belgium | 11.03% | 19.73% | 32.83% |
๐ง๐ฟ Belize | 3.57% | 5.09% | 29.21% |
๐ง๐ฏ Benin | 7.85% | 3.06% | 11.03% |
๐ง๐ฒ Bermuda | 5.71% | 20.41% | 37.73% |
๐ง๐น Bhutan | 2.53% | 6.25% | 33.35% |
๐ง๐ด Bolivia | 6.11% | 4.85% | 21.75% |
๐ง๐ถ Bonaire Sint Eustatius and Saba | 14.22% | 13.84% | 28.94% |
๐ง๐ฆ Bosnia and Herzegovina | 3.95% | 18.4% | 36.4% |
๐ง๐ผ Botswana | 4.32% | 3.65% | 17.96% |
๐ง๐ท Brazil | 2.39% | 9.88% | 33.52% |
๐ป๐ฌ British Virgin Islands | 8.63% | 9.95% | 32.47% |
๐ง๐ณ Brunei | 4.85% | 6.17% | 30.93% |
๐ง๐ฌ Bulgaria | 6.66% | 22.38% | 37.13% |
๐ง๐ซ Burkina Faso | 2.01% | 2.53% | 13.07% |
๐ง๐ฎ Burundi | 3.22% | 2.48% | 13.23% |
๐ฐ๐ญ Cambodia | 2.67% | 5.81% | 26.43% |
๐จ๐ฒ Cameroon | 3.47% | 2.67% | 11.89% |
๐จ๐ฆ Canada | 7.7% | 19.03% | 31.55% |
๐จ๐ป Cape Verde | 3.67% | 5.55% | 32.63% |
๐ฐ๐พ Cayman Islands | 6.05% | 8.17% | 28.75% |
๐จ๐ซ Central African Republic | 5.% | 2.51% | 11.43% |
๐น๐ฉ Chad | 4.33% | 2.01% | 9.64% |
๐จ๐ฑ Chile | 3.3% | 13.03% | 36.61% |
๐จ๐ณ China | 5.04% | 13.72% | 40.93% |
๐จ๐ด Colombia | 3.22% | 9.% | 34.49% |
๐ฐ๐ฒ Comoros | 3.8% | 4.28% | 17.81% |
๐จ๐ฌ Congo | 3.36% | 2.72% | 11.99% |
๐จ๐ฐ Cook Islands | 2.94% | 11.73% | 29.75% |
๐จ๐ท Costa Rica | 2.97% | 10.83% | 36.99% |
๐จ๐ฎ Cote d'Ivoire | 2.21% | 2.4% | 10.86% |
๐ญ๐ท Croatia | 7.82% | 22.36% | 37.03% |
๐จ๐บ Cuba | 4.36% | 15.81% | 36.31% |
๐จ๐ผ Curacao | 5.82% | 14.95% | 30.46% |
๐จ๐พ Cyprus | 5.95% | 14.83% | 33.36% |
๐จ๐ฟ Czechia | 8.29% | 20.64% | 26.94% |
๐จ๐ฉ Democratic Republic of Congo | 3.77% | 2.92% | 10.62% |
๐ฉ๐ฐ Denmark | 9.04% | 20.49% | 30.45% |
๐ฉ๐ฏ Djibouti | 1.99% | 4.54% | 19.68% |
๐ฉ๐ฒ Dominica | 7.67% | 9.53% | 34.28% |
๐ฉ๐ด Dominican Republic | 2.72% | 7.4% | 30.47% |
๐ช๐จ Ecuador | 5.2% | 7.83% | 31.97% |
๐ช๐ฌ Egypt | 2.95% | 4.83% | 21.77% |
๐ธ๐ป El Salvador | 3.93% | 8.22% | 36.02% |
๐ฌ๐ถ Equatorial Guinea | 5.53% | 3.12% | 15.13% |
๐ช๐ท Eritrea | 3.2% | 4.01% | 19.86% |
๐ช๐ช Estonia | 10.56% | 20.58% | 34.15% |
๐ธ๐ฟ Eswatini | 2.68% | 4.% | 16.26% |
๐ช๐น Ethiopia | 3.01% | 3.14% | 18.6% |
๐ซ๐ด Faeroe Islands | 7.59% | 17.92% | 26.91% |
๐ซ๐ฐ Falkland Islands | 8.27% | 11.08% | 35.86% |
๐ซ๐ฏ Fiji | 5.99% | 5.9% | 20.6% |
๐ซ๐ฎ Finland | 6.63% | 23.27% | 34.04% |
๐ซ๐ท France | 11.39% | 21.66% | 34.23% |
๐ฌ๐ซ French Guiana | 7.96% | 5.98% | 21.13% |
๐ต๐ซ French Polynesia | 3.% | 10.07% | 37.85% |
๐ฌ๐ฆ Gabon | 7.21% | 3.89% | 16.25% |
๐ฌ๐ฒ Gambia | 2.5% | 2.43% | 16.06% |
๐ฌ๐ช Georgia | 9.35% | 14.61% | 31.19% |
๐ฉ๐ช Germany | 9.46% | 22.41% | 33.72% |
๐ฌ๐ญ Ghana | 4.62% | 3.55% | 15.91% |
๐ฌ๐ฎ Gibraltar | 6.94% | 20.84% | 37.63% |
๐ฌ๐ท Greece | 6.8% | 22.82% | 37.52% |
๐ฌ๐ฑ Greenland | 3.06% | 10.02% | 29.16% |
๐ฌ๐ฉ Grenada | 5.12% | 10.07% | 30.54% |
๐ฌ๐ต Guadeloupe | 5.51% | 20.04% | 34.45% |
๐ฌ๐บ Guam | 1.11% | 11.84% | 31.19% |
๐ฌ๐น Guatemala | 2.31% | 4.91% | 28.05% |
๐ฌ๐ฌ Guernsey | 11.96% | 16.64% | 35.4% |
๐ฌ๐ณ Guinea | 5.39% | 3.32% | 14.% |
๐ฌ๐ผ Guinea-Bissau | 3.45% | 2.82% | 14.34% |
๐ฌ๐พ Guyana | 3.89% | 6.28% | 28.94% |
๐ญ๐น Haiti | 3.64% | 4.54% | 19.07% |
๐ญ๐ณ Honduras | 3.96% | 4.27% | 26.5% |
๐ญ๐ฐ Hong Kong | 2.48% | 20.47% | 41.64% |
๐ญ๐บ Hungary | 7.81% | 20.01% | 31.85% |
๐ฎ๐ธ Iceland | 7.52% | 15.33% | 34.25% |
๐ฎ๐ณ India | 3.1% | 6.9% | 29.81% |
๐ฎ๐ฉ Indonesia | 1.74% | 6.86% | 25.28% |
๐ฎ๐ท Iran | 5.22% | 7.62% | 33.72% |
๐ฎ๐ถ Iraq | 2.79% | 3.41% | 18.44% |
๐ฎ๐ช Ireland | 10.99% | 15.14% | 32.48% |
๐ฎ๐ฒ Isle of Man | 13.9% | 22.29% | 31.8% |
๐ฎ๐ฑ Israel | 4.% | 12.04% | 25.97% |
๐ฎ๐น Italy | 8.09% | 24.05% | 38.19% |
๐ฏ๐ฒ Jamaica | 3.83% | 7.45% | 44.05% |
๐ฏ๐ต Japan | 4.89% | 29.92% | 38.7% |
๐ฏ๐ช Jersey | 12.34% | 16.22% | 30.52% |
๐ฏ๐ด Jordan | 5.03% | 3.84% | 27.3% |
๐ฐ๐ฟ Kazakhstan | 6.47% | 8.04% | 19.58% |
๐ฐ๐ช Kenya | 5.28% | 2.87% | 16.98% |
๐ฐ๐ฎ Kiribati | 7.13% | 3.81% | 17.33% |
๐ฝ๐ฐ Kosovo | 5.33% | 10.19% | 43.35% |
๐ฐ๐ผ Kuwait | 2.88% | 4.93% | 31.56% |
๐ฐ๐ฌ Kyrgyzstan | 7.91% | 4.54% | 21.08% |
๐ฑ๐ฆ Laos | 2.13% | 4.45% | 25.24% |
๐ฑ๐ป Latvia | 10.12% | 21.86% | 32.86% |
๐ฑ๐ง Lebanon | 7.24% | 9.89% | 32.11% |
๐ฑ๐ธ Lesotho | 6.34% | 4.2% | 13.44% |
๐ฑ๐ท Liberia | 2.97% | 3.31% | 13.88% |
๐ฑ๐พ Libya | 5.21% | 4.86% | 27.77% |
๐ฑ๐ฎ Liechtenstein | 7.89% | 19.37% | 34.79% |
๐ฑ๐น Lithuania | 8.65% | 20.8% | 32.79% |
๐ฑ๐บ Luxembourg | 9.71% | 15.03% | 31.55% |
๐ฒ๐ด Macao | 3.11% | 13.% | 32.39% |
๐ฒ๐ฌ Madagascar | 3.25% | 3.35% | 16.21% |
๐ฒ๐ผ Malawi | 3.06% | 2.61% | 15.61% |
๐ฒ๐พ Malaysia | 4.91% | 7.5% | 30.78% |
๐ฒ๐ป Maldives | 3.14% | 4.78% | 35.61% |
๐ฒ๐ฑ Mali | 2.78% | 2.38% | 11.% |
๐ฒ๐น Malta | 7.42% | 19.13% | 38.26% |
๐ฒ๐ญ Marshall Islands | 5.68% | 4.56% | 17.8% |
๐ฒ๐ถ Martinique | 5.85% | 22.77% | 37.31% |
๐ฒ๐ท Mauritania | 1.44% | 3.22% | 15.03% |
๐ฒ๐บ Mauritius | 3.18% | 12.79% | 33.76% |
๐พ๐น Mayotte | 6.61% | 2.88% | 18.15% |
๐ฒ๐ฝ Mexico | 2.99% | 8.32% | 34.88% |
๐ซ๐ฒ Micronesia (country) | 4.11% | 6.16% | 27.59% |
๐ฒ๐ฉ Moldova | 7.56% | 12.98% | 26.36% |
๐ฒ๐จ Monaco | 15.64% | 35.92% | 30.16% |
๐ฒ๐ณ Mongolia | 3.87% | 4.61% | 26.18% |
๐ฒ๐ช Montenegro | 7.85% | 16.55% | 34.16% |
๐ฒ๐ธ Montserrat | 7.92% | 17.7% | 33.05% |
๐ฒ๐ฆ Morocco | 2.86% | 7.72% | 29.97% |
๐ฒ๐ฟ Mozambique | 3.13% | 2.57% | 13.43% |
๐ฒ๐ฒ Myanmar | 3.21% | 6.82% | 23.69% |
๐ณ๐ฆ Namibia | 4.1% | 3.97% | 15.38% |
๐ณ๐ท Nauru | 8.98% | 2.5% | 15.87% |
๐ณ๐ต Nepal | 2.74% | 6.09% | 29.51% |
๐ณ๐ฑ Netherlands | 7.76% | 20.31% | 32.89% |
๐ณ๐จ New Caledonia | 5.% | 11.02% | 31.61% |
๐ณ๐ฟ New Zealand | 9.09% | 16.31% | 33.2% |
๐ณ๐ฎ Nicaragua | 2.71% | 5.29% | 28.92% |
๐ณ๐ช Niger | .92% | 2.4% | 9.76% |
๐ณ๐ฌ Nigeria | 3.% | 2.97% | 12.31% |
๐ณ๐บ Niue | 4.79% | 15.16% | 22.55% |
๐ฐ๐ต North Korea | 2.72% | 11.71% | 30.49% |
๐ฒ๐ฐ North Macedonia | 5.87% | 14.91% | 36.56% |
๐ฒ๐ต Northern Mariana Islands | 2.95% | 10.81% | 32.09% |
๐ณ๐ด Norway | 9.52% | 18.44% | 31.65% |
๐ด๐ฒ Oman | 3.05% | 2.76% | 23.96% |
๐ต๐ฐ Pakistan | 5.48% | 4.27% | 17.23% |
๐ต๐ผ Palau | 8.59% | 9.93% | 21.48% |
๐ต๐ธ Palestine | 4.77% | 3.53% | 23.44% |
๐ต๐ฆ Panama | 3.57% | 8.77% | 30.03% |
๐ต๐ฌ Papua New Guinea | 1.09% | 3.19% | 16.81% |
๐ต๐พ Paraguay | 3.73% | 6.26% | 26.51% |
๐ต๐ช Peru | 3.43% | 8.41% | 30.33% |
๐ต๐ญ Philippines | 3.56% | 5.44% | 23.38% |
๐ต๐ฑ Poland | 5.22% | 18.55% | 35.69% |
๐ต๐น Portugal | 7.% | 22.9% | 36.28% |
๐ต๐ท Puerto Rico | 3.63% | 22.93% | 48.9% |
๐ถ๐ฆ Qatar | 3.5% | 1.52% | 15.01% |
๐ท๐ช Reunion | 3.81% | 13.28% | 32.4% |
๐ท๐ด Romania | 7.16% | 18.64% | 32.22% |
๐ท๐บ Russia | 4.8% | 15.8% | 27.86% |
๐ท๐ผ Rwanda | 2.76% | 3.2% | 17.36% |
๐ง๐ฑ Saint Barthlemy | 7.3% | 10.61% | 43.89% |
๐ธ๐ญ Saint Helena | 8.63% | 28.66% | 32.61% |
๐ฐ๐ณ Saint Kitts and Nevis | 5.36% | 10.13% | 29.79% |
๐ฑ๐จ Saint Lucia | 3.59% | 9.23% | 33.39% |
๐ฒ๐ซ Saint Martin (French part) | 4.47% | 11.14% | 30.08% |
๐ต๐ฒ Saint Pierre and Miquelon | 6.34% | 17.32% | 33.4% |
๐ป๐จ Saint Vincent and the Grenadines | 7.71% | 10.86% | 32.34% |
๐ผ๐ธ Samoa | 2.52% | 5.22% | 18.75% |
๐ธ๐ฒ San Marino | 10.15% | 20.47% | 35.73% |
๐ธ๐น Sao Tome and Principe | 3.92% | 3.76% | 15.6% |
๐ธ๐ฆ Saudi Arabia | 3.32% | 2.81% | 30.28% |
๐ธ๐ณ Senegal | 3.42% | 3.14% | 16.54% |
๐ท๐ธ Serbia | 6.15% | 20.56% | 37.55% |
๐ธ๐จ Seychelles | 10.68% | 8.16% | 28.84% |
๐ธ๐ฑ Sierra Leone | 3.02% | 3.14% | 15.52% |
๐ธ๐ฌ Singapore | 2.29% | 15.12% | 36.51% |
๐ธ๐ฝ Sint Maarten (Dutch part) | 12.03% | 10.57% | 34.51% |
๐ธ๐ฐ Slovakia | 6.63% | 16.98% | 33.4% |
๐ธ๐ฎ Slovenia | 7.52% | 20.96% | 33.59% |
๐ธ๐ง Solomon Islands | 4.03% | 3.47% | 15.29% |
๐ธ๐ด Somalia | 2.6% | 2.57% | 10.75% |
๐ฟ๐ฆ South Africa | 4.06% | 5.89% | 20.55% |
๐ฐ๐ท South Korea | 2.74% | 17.49% | 44.44% |
๐ธ๐ธ South Sudan | 3.48% | 2.89% | 13.11% |
๐ช๐ธ Spain | 7.23% | 20.27% | 38.72% |
๐ฑ๐ฐ Sri Lanka | 8.76% | 11.54% | 35.73% |
๐ธ๐ฉ Sudan | 3.03% | 3.5% | 13.28% |
๐ธ๐ท Suriname | 4.09% | 7.39% | 25.8% |
๐ธ๐ช Sweden | 10.19% | 20.25% | 31.83% |
๐จ๐ญ Switzerland | 9.49% | 19.31% | 32.61% |
๐ธ๐พ Syria | 7.66% | 4.68% | 24.62% |
๐น๐ผ Taiwan | 2.11% | 16.71% | 37.32% |
๐น๐ฏ Tajikistan | 4.34% | 3.47% | 19.43% |
๐น๐ฟ Tanzania | 2.2% | 3.1% | 14.97% |
๐น๐ญ Thailand | 3.21% | 15.21% | 39.17% |
๐น๐ฑ Timor | 3.14% | 5.21% | 25.42% |
๐น๐ฌ Togo | 4.29% | 3.13% | 11.77% |
๐น๐ฐ Tokelau | 4.7% | 8.66% | 25.03% |
๐น๐ด Tonga | 4.6% | 6.22% | 21.65% |
๐น๐น Trinidad and Tobago | 3.93% | 11.52% | 32.67% |
๐น๐ณ Tunisia | 4.4% | 9.02% | 31.24% |
๐น๐ท Turkey | 3.77% | 8.64% | 33.9% |
๐น๐ฒ Turkmenistan | 5.84% | 5.15% | 21.55% |
๐น๐จ Turks and Caicos Islands | 5.79% | 10.34% | 28.25% |
๐น๐ป Tuvalu | 4.98% | 6.48% | 16.15% |
๐บ๐ฌ Uganda | 2.87% | 1.69% | 14.33% |
๐บ๐ฆ Ukraine | 7.54% | 18.81% | 33.2% |
๐ฆ๐ช United Arab Emirates | 3.35% | 1.83% | 15.77% |
๐ฌ๐ง United Kingdom | 10.84% | 19.17% | 32.56% |
๐บ๐ธ United States | 8.18% | 17.13% | 30.47% |
๐ป๐ฎ United States Virgin Islands | 7.54% | 20.42% | 39.11% |
๐บ๐พ Uruguay | 8.23% | 15.58% | 35.98% |
๐บ๐ฟ Uzbekistan | 5.87% | 5.14% | 22.24% |
๐ป๐บ Vanuatu | 5.65% | 3.74% | 16.29% |
๐ป๐ช Venezuela | 2.29% | 8.61% | 27.71% |
๐ป๐ณ Vietnam | 4.13% | 9.12% | 30.02% |
๐ผ๐ซ Wallis and Futuna | 1.76% | 13.47% | 32.98% |
๐ช๐ญ Western Sahara | 2.82% | 5.84% | 23.73% |
๐พ๐ช Yemen | 3.98% | 2.66% | 18.25% |
๐ฟ๐ฒ Zambia | 2.76% | 1.75% | 12.66% |
๐ฟ๐ผ Zimbabwe | 3.18% | 3.32% | 14.22% |
๐ World | 5.13% | 9.82% | 24.03% |
Some of the places with high elderly shares today include high-income countries like Japan (30%), Italy (24%), and Finland (23%).
The lowest shares are concentrated in the Middle East and Africa. Many countries have just 2% of their population aged 65 years and older, such as Qatar, Uganda, and Afghanistan.
But over time, almost all countries are expected to see their older population segments grow. In just three decades, it is estimated that one-in-four European, North American, and Asian residents will be over 65 years of age.
By 2100, a variety of Asian countries and island nations facing low population growth are expected to see more than one-third of their populations aged 65 years or older, including South Korea and Jamaica at 44%. However, it’s actually Albania that’s the biggest outlier overall, with a projected 49% of its population to be aged 65 and older by 2100.
Passing the Generational Torch
The challenge of an aging population is set to impact all sectors of society, including labor and financial markets, demand for housing and transportation, and especially family structures and intergenerational ties.
One way to help grasp the nature of transition is to note the changing ratio between seniors and young children in the world population, as seen in the below crossover diagram:
Dropping fertility rates, in addition to improved child and infant mortality rates, are known to have played a major role in the plateauing population of children.
However, not all countries have witnessed this crossover yet, as it usually coincides with higher levels of economic development.
As countries such as India, Brazil, and South Africa reach higher levels of per capita income, they will be likely to follow down the paths of more advanced economies, eventually experiencing similar demographic fates and challenges.
-
Money4 weeks ago
Comparing the Speed of Interest Rate Hikes (1988-2023)
-
Misc2 weeks ago
Ranked: The Cities with the Most Skyscrapers in 2023
-
War4 weeks ago
Map Explainer: Sudan
-
Urbanization2 weeks ago
Ranked: The World’s Biggest Steel Producers, by Country
-
Travel4 weeks ago
Visualized: The World’s Busiest Airports, by Passenger Count
-
Visual Capitalist2 weeks ago
Join Us For Data Creator Con 2023
-
Technology4 weeks ago
Visualizing Global Attitudes Towards AI
-
Economy1 week ago
Charted: Public Trust in the Federal Reserve