Misc
Visualizing Well-Known Airlines by Fleet Composition


Visualizing Well-Known Airlines by Fleet Composition
How many airplanes do the world’s major airlines utilize in their fleets, and which models do they prefer?
Some prefer newer planes, such as the Boeing 787 Dreamliner which came into service in the 2010s. Others prefer large planes, like the Airbus A380 , the world’s largest passenger aircraft. A few carriers, like Air France–KLM, opt for variety. The airline uses 16 different active models. This contrasts with Southwest Airlines, which utilizes a single model in its fleet.
This series of graphics visualizes some of the world’s most well-known airliners by fleet composition, using fleet data from Planespotters.net as of May 26, 2022.
How Many Planes Are in Airline Fleets?
Each plane in a fleet is tracked in meticulous detail, from its start of service date and age, to its registration number and current status.
Above we visualized the parent airline’s current fleets, which includes planes that are either in service or parked for future service. They do not include retired planes (the historic fleet) or future planes on order.
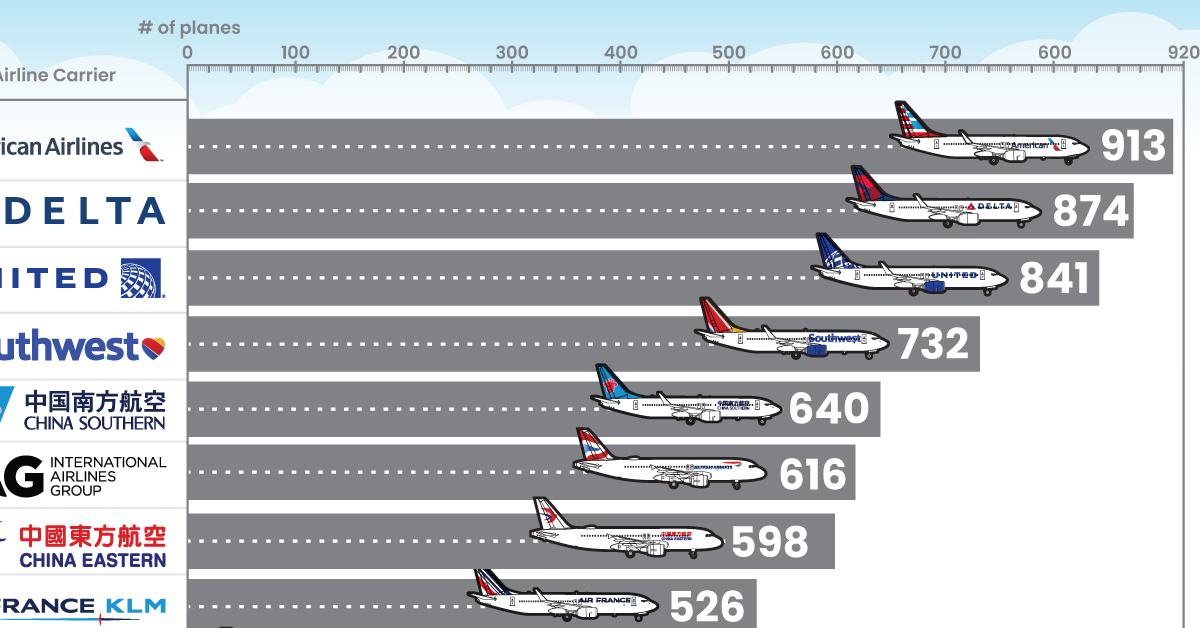
From conglomerates to flag carriers, here are some of the world’s most well-known airline fleets:
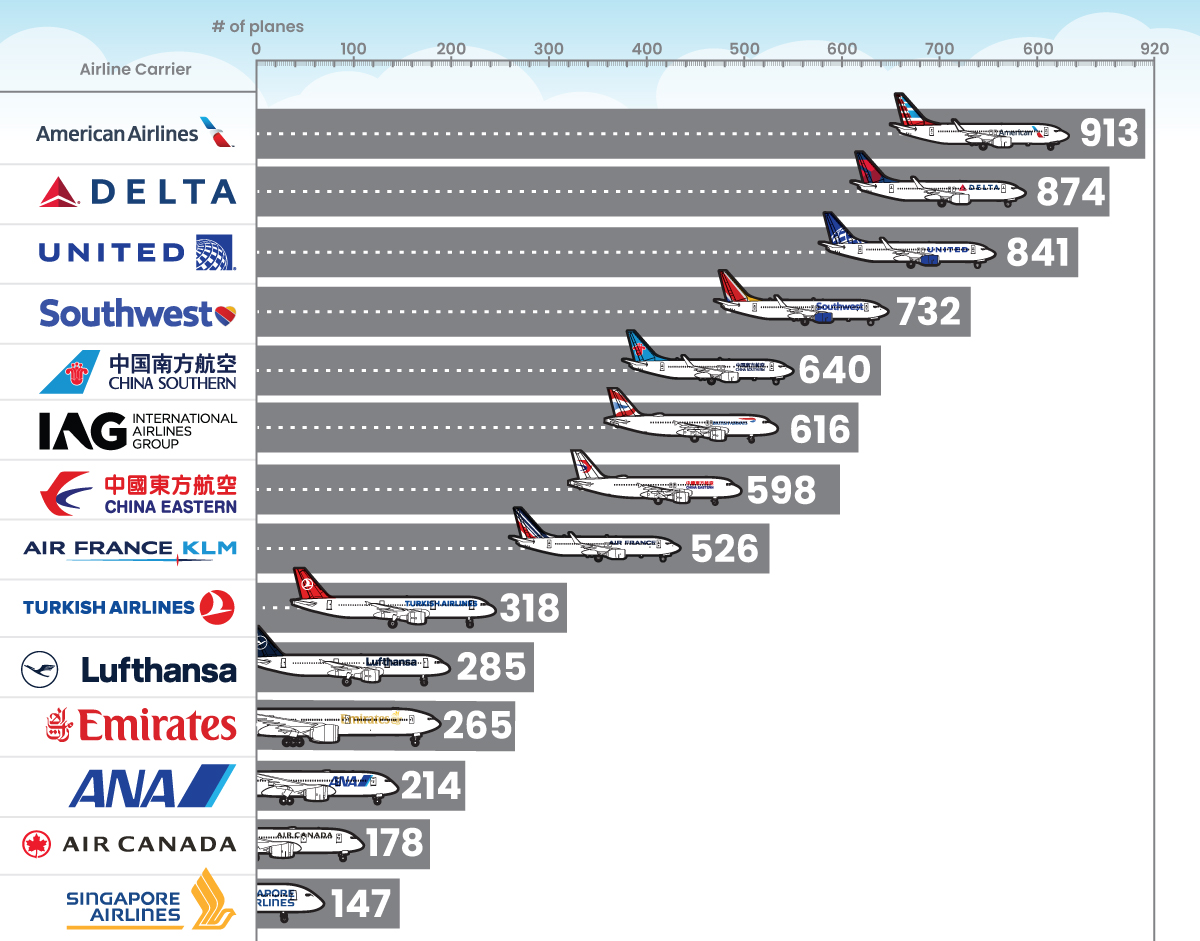
U.S. based airlines were far and away the largest aircraft carriers, with American Airlines being the world’s largest airline by fleet size since 2019. Interestingly, Delta Airlines was the largest by revenue in 2020, despite a smaller fleet size.
Asia’s largest airline has been China Southern, in both fleet size, revenue, and passengers carried. Together with China Eastern and the flag carrier Air China, it is part of China’s “Big Three” airlines.
But smaller airlines aren’t any less important, or lucrative. The slightly smaller fleet size of International Airlines Group (IAG), which was formed from a merger between flag carriers British Airways and Iberia, includes planes that fly on the world’s highest grossing routes. They’re joined on the list by other smaller fleets including UAE airliner Emirates, Singapore Airlines (often ranked as the world’s best airline), and Air Canada.
Boeing, Airbus, and Other Aircraft Manufacturers
The story of airline fleets usually breaks down to the world’s largest aircraft manufacturers, Europe’s Airbus and America’s Boeing.
By outlasting key competitors and mergers in a difficult industry, the duopoly has solidified a grasp on the commercial aircraft sector. In 2019, they were estimated to control a combined 91% of the global commercial aircraft market.
Which manufacturers do the world’s popular airlines utilize? Here’s a breakdown of the same airlines from above, this time by manufacturer share:
| Share of Airline Fleets by Manufacturer (Oct 2021) | Airbus | Boeing | Other |
|---|---|---|---|
| Lufthansa | 86.7% | 9.5% | 3.9% |
| IAG | 72.6% | 14.8% | 12.7% |
| China Eastern | 71.1% | 28.9% | 0.0% |
| Turkish Airlines | 57.2% | 42.8% | 0.0% |
| China Southern | 56.7% | 42.2% | 1.1% |
| Singapore Airlines | 51.7% | 48.3% | 0.0% |
| American Airlines | 49.8% | 50.2% | 0.0% |
| Emirates | 45.7% | 54.3% | 0.0% |
| Delta | 43.8% | 56.2% | 0.0% |
| Air Canada | 43.3% | 56.7% | 0.0% |
| Air France–KLM | 28.5% | 51.7% | 19.8% |
| United Airlines | 22.8% | 77.2% | 0.0% |
| All Nippon Airways (ANA) | 18.7% | 81.3% | 0.0% |
| Southwest Airlines | 0.0% | 100.0% | 0.0% |
Notably, European and Asian airlines have emerged as slightly bigger Airbus customers, while American carriers favor Boeing. There are also standouts, such as Southwest Airlines’ utilization of just one make, the Boeing 737.
And a few carriers used aircraft from other manufacturers as well. Brazil’s Embraer saw usage in IAG and Air France–KLM, making up 17% of the latter’s total fleet. Bombardier‘s CJR planes, formerly produced by the Canadian manufacturer but now owned by the Mitsubishi Aircraft Corporation, saw use by IAG, Air France–KLM, and Lufthansa. The Airbus A220 was also originally a Bombardier plane before being acquired by the European manufacturer in 2018.
China Southern Airlines was the only other airline to feature a different manufacturer’s plane in its active fleet, the ARJ21. Also known as the Xiangfeng (literally “soaring phoenix”), it was developed by Chinese state-owned manufacturer Comac and first introduced into service in 2016.
What Will Airlines Use in the Future?
Before the COVID-19 pandemic, Airbus was starting to outperform Boeing in market share.
In 2019, the worldwide grounding of the Boeing 737 MAX model after two crashes saw 387 active aircraft grounded and 1,200 canceled orders, a debacle that could go down as the most costly corporate blunder in history.
Soon after, Airbus took the global market share lead in new orders, with the Airbus A320 becoming the world’s highest selling family of aircraft in October 2019. But the COVID-19 pandemic quickly followed and severely impacted the entire aviation industry.
As countries, airliners, and manufacturers look to bounce back and recover, fleet compositions are sure to change in coming years.


VC+
VC+: Get Our Key Takeaways From the IMF’s World Economic Outlook
A sneak preview of the exclusive VC+ Special Dispatch—your shortcut to understanding IMF’s World Economic Outlook report.

Have you read IMF’s latest World Economic Outlook yet? At a daunting 202 pages, we don’t blame you if it’s still on your to-do list.
But don’t worry, you don’t need to read the whole April release, because we’ve already done the hard work for you.
To save you time and effort, the Visual Capitalist team has compiled a visual analysis of everything you need to know from the report—and our VC+ Special Dispatch is available exclusively to VC+ members. All you need to do is log into the VC+ Archive.
If you’re not already subscribed to VC+, make sure you sign up now to access the full analysis of the IMF report, and more (we release similar deep dives every week).
For now, here’s what VC+ members get to see.
Your Shortcut to Understanding IMF’s World Economic Outlook
With long and short-term growth prospects declining for many countries around the world, this Special Dispatch offers a visual analysis of the key figures and takeaways from the IMF’s report including:
- The global decline in economic growth forecasts
- Real GDP growth and inflation forecasts for major nations in 2024
- When interest rate cuts will happen and interest rate forecasts
- How debt-to-GDP ratios have changed since 2000
- And much more!

Get the Full Breakdown in the Next VC+ Special Dispatch
VC+ members can access the full Special Dispatch by logging into the VC+ Archive, where you can also check out previous releases.
Make sure you join VC+ now to see exclusive charts and the full analysis of key takeaways from IMF’s World Economic Outlook.
Don’t miss out. Become a VC+ member today.
What You Get When You Become a VC+ Member
VC+ is Visual Capitalist’s premium subscription. As a member, you’ll get the following:
- Special Dispatches: Deep dive visual briefings on crucial reports and global trends
- Markets This Month: A snappy summary of the state of the markets and what to look out for
- The Trendline: Weekly curation of the best visualizations from across the globe
- Global Forecast Series: Our flagship annual report that covers everything you need to know related to the economy, markets, geopolitics, and the latest tech trends
- VC+ Archive: Hundreds of previously released VC+ briefings and reports that you’ve been missing out on, all in one dedicated hub
You can get all of the above, and more, by joining VC+ today.

-

 Misc1 week ago
How Hard Is It to Get Into an Ivy League School?
-

 Technology2 weeks ago
Ranked: Semiconductor Companies by Industry Revenue Share
-

 Markets2 weeks ago
Ranked: The World’s Top Flight Routes, by Revenue
-

 Countries2 weeks ago
Population Projections: The World’s 6 Largest Countries in 2075
-

 Markets2 weeks ago
The Top 10 States by Real GDP Growth in 2023
-

 Demographics2 weeks ago
The Smallest Gender Wage Gaps in OECD Countries
-

 United States2 weeks ago
Where U.S. Inflation Hit the Hardest in March 2024
-

 Environment2 weeks ago
Top Countries By Forest Growth Since 2001