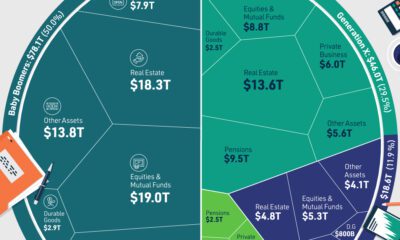

We've visualized data from the Federal Reserve to provide a comprehensive break down of U.S. assets by generation.
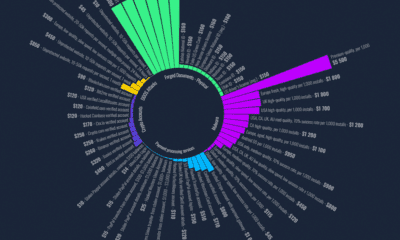

This chart looks at some of the common items that are sold on the Dark Web, and how much they sold for on average in 2022.
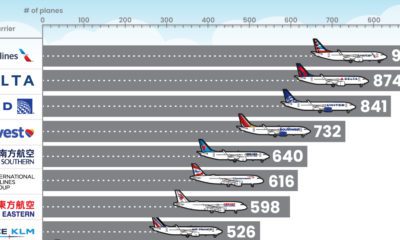

What type of aircraft do the world’s largest airlines use? This infographic breaks down the airline fleets of major carriers
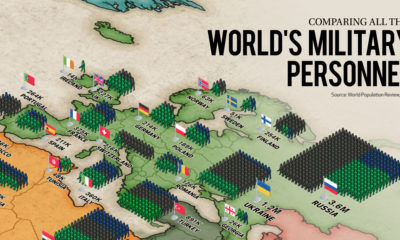

Which countries have the biggest militaries in the world? This map reveals all the world’s military personnel.
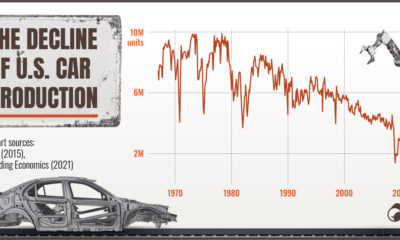

U.S. car production has been in a long-term downward trend since the 1970s. We examine some of the factors driving this trend.


From Fords in the Midwest to Toyotas on the coasts, here are the best selling vehicles in America, visualized by state.
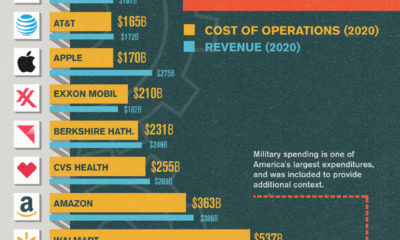

Running a Fortune 500 company is a costly endeavor. In this chart, we compare the operating costs of America's biggest names.


As the global chip shortage causes delays in automotive production, what models and manufacturers are being hit the hardest?
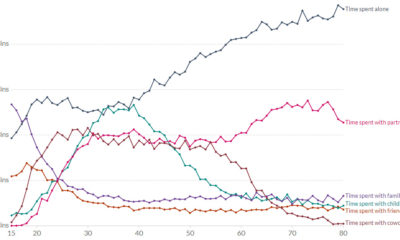

Ever wondered who Americans spend the most time with? This chart assesses how many minutes per day Americans spend with different people.
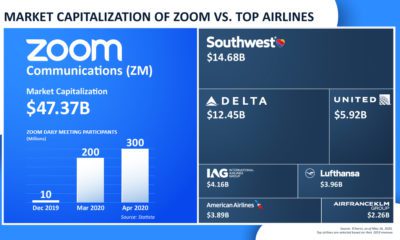

Zoom benefits from the COVID-19 virtual transition—but other industries aren't as lucky. The app is now more valuable than the world's seven largest airlines.