Markets
Visualizing the World’s Largest Airline Companies
Through most of its history, the commercial airline industry has had a somewhat turbulent relationship with investors.
For example, during the span of 2003-2011, the three major U.S. carriers (American, United, and Delta) all filed for bankruptcy, and this was subsequently after merging with other large airlines (US Airways, Continental, and Northwest) that each had their own solvency issues.
Despite the rough ride a decade ago, just last year the industry raked in $35.6 billion in profits – a record-setting amount according to the International Air Transport Association (IATA). Even legendary investor Warren Buffett is flying high on airline stocks at the moment, and he’s recently floated the idea of buying a whole carrier for Berkshire’s portfolio.
Comparing Airlines
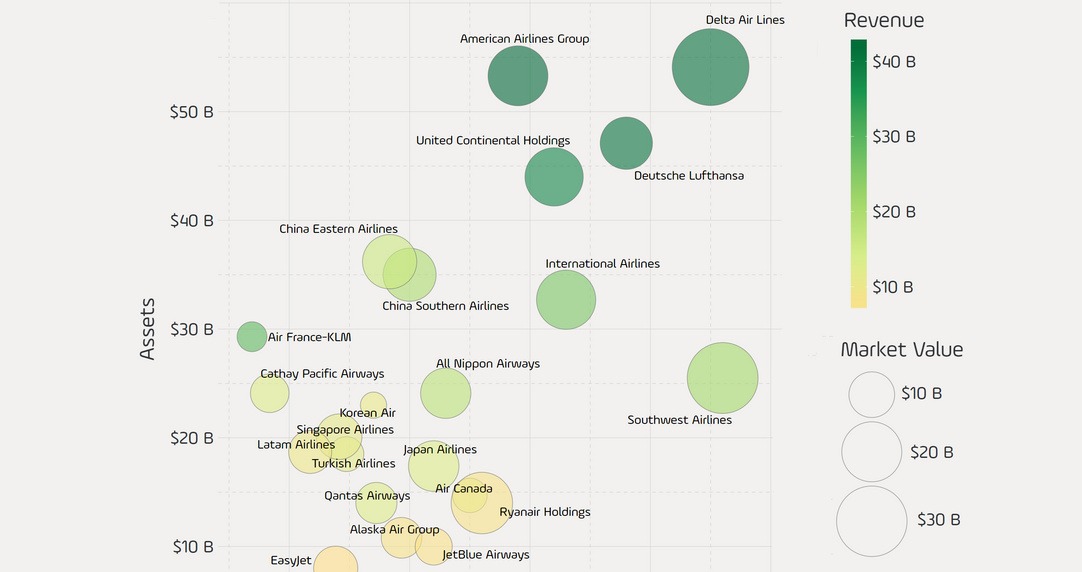
Today’s graphic comes from Reddit user /u/takeasecond and it uses data from the Forbes Global 2000 list to plot the world’s largest publicly-traded airlines in terms of revenue, profit, assets, and market value.
It provides some interesting insights on the industry, showing some unexpected carriers leading the way.
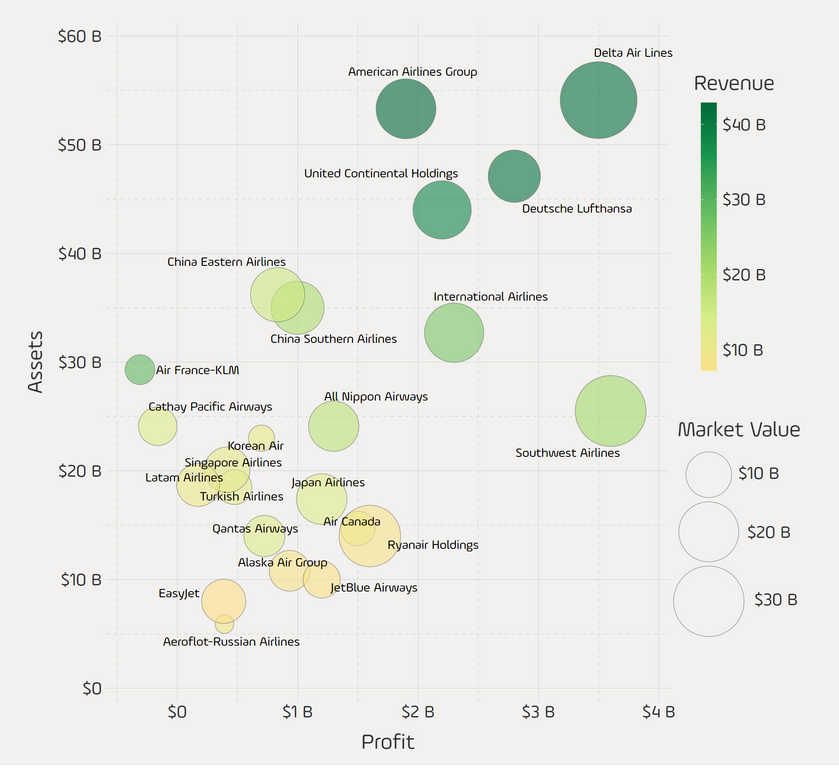
There are four companies that stand out instantly on the chart. Air France-KLM and Cathay Pacific are both easy to spot, but for the wrong reasons. They are to the left of the $0 profit line, and Forbes has their most recent net incomes listed as -$309 million and -$162 million respectively.
In the upper right corner, Delta Air Lines appears to be one of the healthiest companies by many measures. It ranks second in sales ($42B) and profitability ($3.5B), and comes out on top in terms of assets ($54B) and market value ($37B).
Finally, to the bottom right is Southwest Airlines – it has the highest profitability ($3.6B) but is able to do it at far higher margins than the rest of the pack.
Ranking Profitability and Sales
Here are two of the most important metrics – revenue and profit – for the 10 publicly-traded airlines with the most sales:
| Rank | Airline | Revenue ($B) | Profit ($B) | Margin |
|---|---|---|---|---|
| #1 | American Airlines | $43.0 | $1.9 | 4.4% |
| #2 | Delta Air Lines | $42.1 | $3.5 | 8.3% |
| #3 | Deutsche Lufthansa | $41.5 | $2.8 | 6.7% |
| #4 | United Continental | $38.3 | $2.2 | 5.7% |
| #5 | Air France-KLM | $29.1 | -$0.3 | -1.1% |
| #6 | International Airlines | $26.0 | $2.3 | 8.8% |
| #7 | Southwest | $21.2 | $3.6 | 17.0% |
| #8 | China Southern | $19.7 | $1.0 | 5.1% |
| #9 | All Nippon | $17.8 | $1.3 | 7.3% |
| #10 | China Eastern | $15.7 | $0.8 | 5.3% |
Note: Margin is calculated based on Forbes’ numbers above
In recent months, the IATA has revised its outlook for 2018 after originally forecasting record-setting airline revenues again.
The organization now sees profits falling to $33.8 billion, a 12% decrease on its original forecast.


Markets
U.S. Debt Interest Payments Reach $1 Trillion
U.S. debt interest payments have surged past the $1 trillion dollar mark, amid high interest rates and an ever-expanding debt burden.


U.S. Debt Interest Payments Reach $1 Trillion
This was originally posted on our Voronoi app. Download the app for free on iOS or Android and discover incredible data-driven charts from a variety of trusted sources.
The cost of paying for America’s national debt crossed the $1 trillion dollar mark in 2023, driven by high interest rates and a record $34 trillion mountain of debt.
Over the last decade, U.S. debt interest payments have more than doubled amid vast government spending during the pandemic crisis. As debt payments continue to soar, the Congressional Budget Office (CBO) reported that debt servicing costs surpassed defense spending for the first time ever this year.
This graphic shows the sharp rise in U.S. debt payments, based on data from the Federal Reserve.
A $1 Trillion Interest Bill, and Growing
Below, we show how U.S. debt interest payments have risen at a faster pace than at another time in modern history:
| Date | Interest Payments | U.S. National Debt |
|---|---|---|
| 2023 | $1.0T | $34.0T |
| 2022 | $830B | $31.4T |
| 2021 | $612B | $29.6T |
| 2020 | $518B | $27.7T |
| 2019 | $564B | $23.2T |
| 2018 | $571B | $22.0T |
| 2017 | $493B | $20.5T |
| 2016 | $460B | $20.0T |
| 2015 | $435B | $18.9T |
| 2014 | $442B | $18.1T |
| 2013 | $425B | $17.2T |
| 2012 | $417B | $16.4T |
| 2011 | $433B | $15.2T |
| 2010 | $400B | $14.0T |
| 2009 | $354B | $12.3T |
| 2008 | $380B | $10.7T |
| 2007 | $414B | $9.2T |
| 2006 | $387B | $8.7T |
| 2005 | $355B | $8.2T |
| 2004 | $318B | $7.6T |
| 2003 | $294B | $7.0T |
| 2002 | $298B | $6.4T |
| 2001 | $318B | $5.9T |
| 2000 | $353B | $5.7T |
| 1999 | $353B | $5.8T |
| 1998 | $360B | $5.6T |
| 1997 | $368B | $5.5T |
| 1996 | $362B | $5.3T |
| 1995 | $357B | $5.0T |
| 1994 | $334B | $4.8T |
| 1993 | $311B | $4.5T |
| 1992 | $306B | $4.2T |
| 1991 | $308B | $3.8T |
| 1990 | $298B | $3.4T |
| 1989 | $275B | $3.0T |
| 1988 | $254B | $2.7T |
| 1987 | $240B | $2.4T |
| 1986 | $225B | $2.2T |
| 1985 | $219B | $1.9T |
| 1984 | $205B | $1.7T |
| 1983 | $176B | $1.4T |
| 1982 | $157B | $1.2T |
| 1981 | $142B | $1.0T |
| 1980 | $113B | $930.2B |
| 1979 | $96B | $845.1B |
| 1978 | $84B | $789.2B |
| 1977 | $69B | $718.9B |
| 1976 | $61B | $653.5B |
| 1975 | $55B | $576.6B |
| 1974 | $50B | $492.7B |
| 1973 | $45B | $469.1B |
| 1972 | $39B | $448.5B |
| 1971 | $36B | $424.1B |
| 1970 | $35B | $389.2B |
| 1969 | $30B | $368.2B |
| 1968 | $25B | $358.0B |
| 1967 | $23B | $344.7B |
| 1966 | $21B | $329.3B |
Interest payments represent seasonally adjusted annual rate at the end of Q4.
At current rates, the U.S. national debt is growing by a remarkable $1 trillion about every 100 days, equal to roughly $3.6 trillion per year.
As the national debt has ballooned, debt payments even exceeded Medicaid outlays in 2023—one of the government’s largest expenditures. On average, the U.S. spent more than $2 billion per day on interest costs last year. Going further, the U.S. government is projected to spend a historic $12.4 trillion on interest payments over the next decade, averaging about $37,100 per American.
Exacerbating matters is that the U.S. is running a steep deficit, which stood at $1.1 trillion for the first six months of fiscal 2024. This has accelerated due to the 43% increase in debt servicing costs along with a $31 billion dollar increase in defense spending from a year earlier. Additionally, a $30 billion increase in funding for the Federal Deposit Insurance Corporation in light of the regional banking crisis last year was a major contributor to the deficit increase.
Overall, the CBO forecasts that roughly 75% of the federal deficit’s increase will be due to interest costs by 2034.

-

 Green1 week ago
Ranked: The Countries With the Most Air Pollution in 2023
-

 AI2 weeks ago
The Stock Performance of U.S. Chipmakers So Far in 2024
-

 Markets2 weeks ago
Charted: Big Four Market Share by S&P 500 Audits
-

 Real Estate2 weeks ago
Ranked: The Most Valuable Housing Markets in America
-

 Money2 weeks ago
Which States Have the Highest Minimum Wage in America?
-

 AI2 weeks ago
Ranked: Semiconductor Companies by Industry Revenue Share
-

 Travel2 weeks ago
Ranked: The World’s Top Flight Routes, by Revenue
-

 Countries2 weeks ago
Population Projections: The World’s 6 Largest Countries in 2075