Business
Flying High: The Top Ten Airline Routes by Revenue
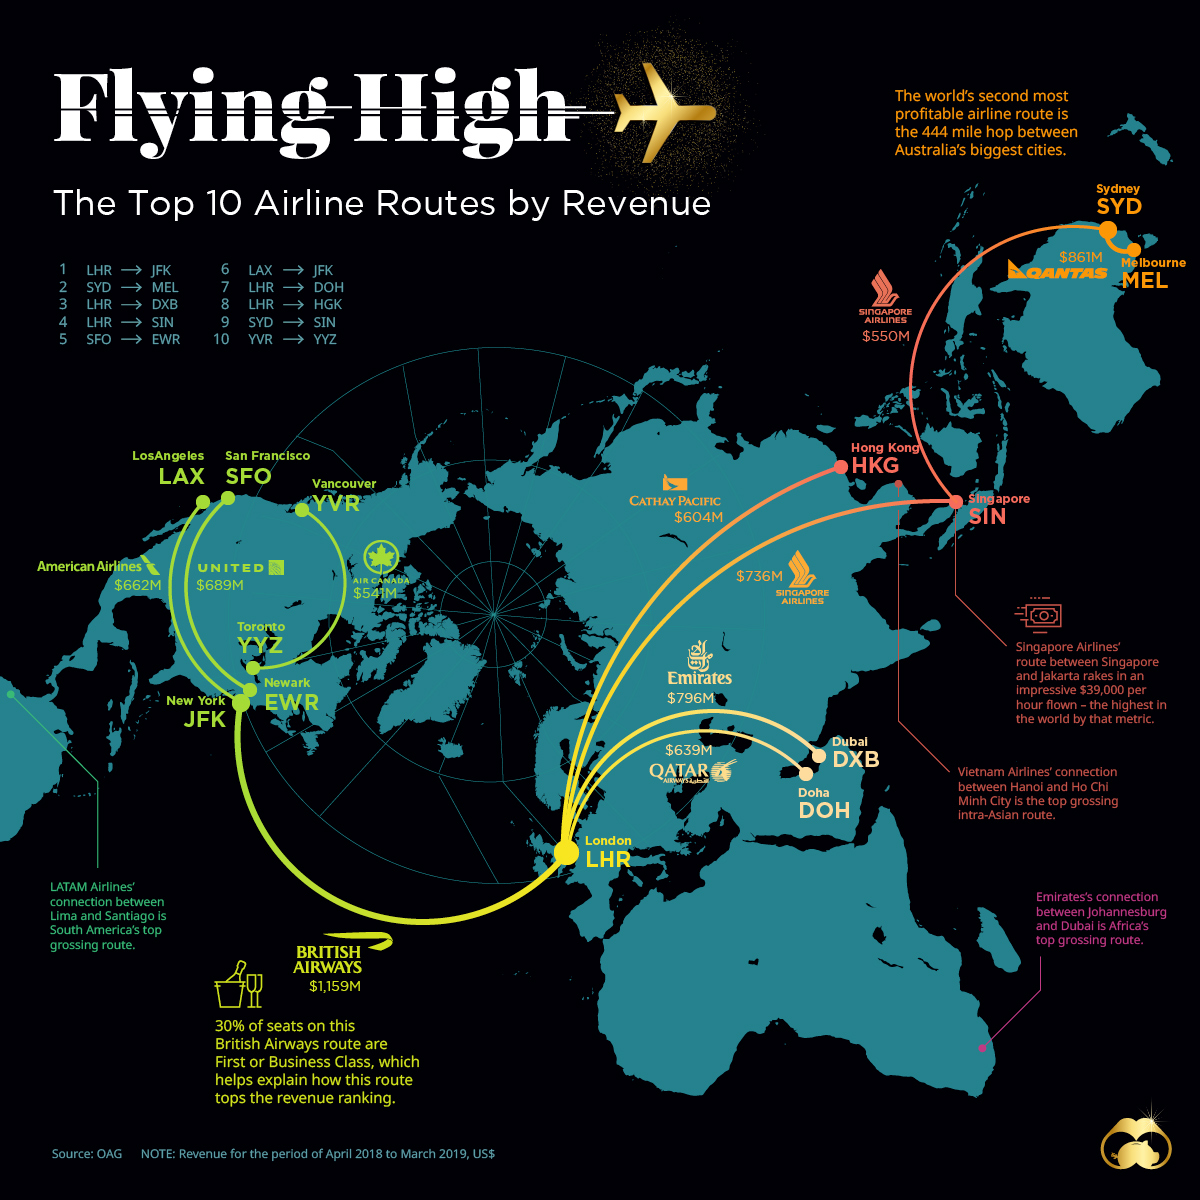
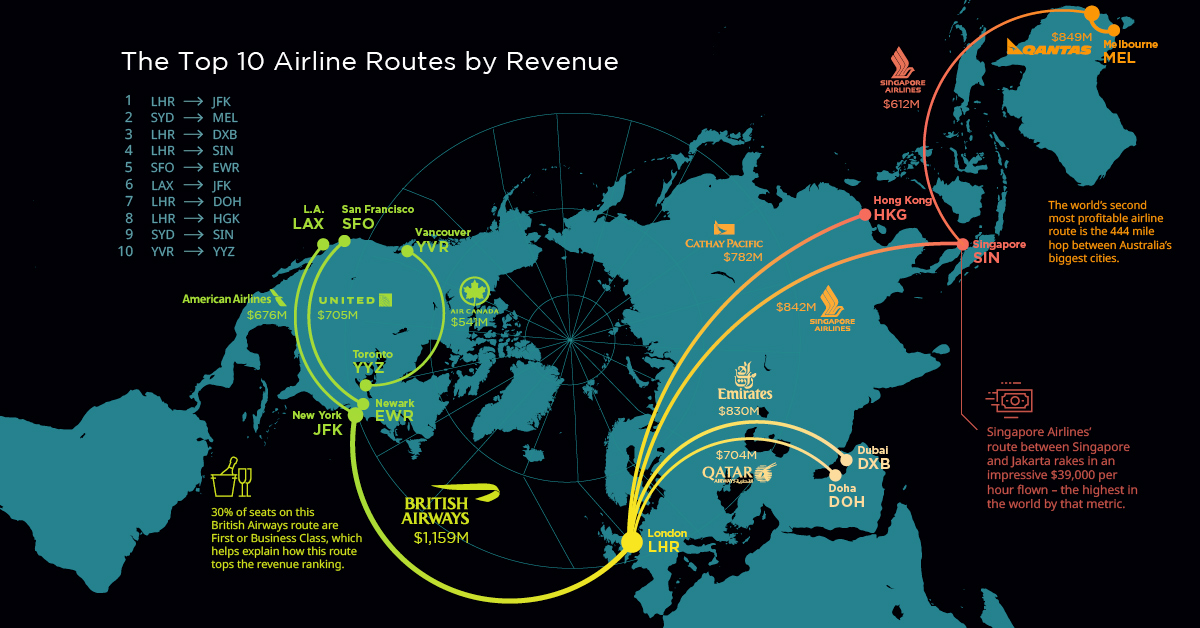
Flying High: The Top 10 Airline Routes by Revenue
The airline industry is a tough business. Profit margins are narrow, airplanes are expensive to run and maintain, and government regulation and taxation can be onerous and unpredictable.
In addition, demand can stall by the outbreak of disease, recession, war, or terrorism. So when a company has a winning airline route, it makes all the difference to a company’s bottom line.
Today’s visualization uses data from OAG Aviation Worldwide, which tracked the airline routes that generated the most revenue from April 2018 to March 2019.
Top 10 Highest Revenue Routes by Airline
North American routes dominate the global rankings. However, it is the connections from the U.S Northeast and Europe that generate the most revenue and often the most delays.
Only one route breaks the billion dollar barrier: British Airways’ service between London Heathrow Airport (LHR) and New York’s John F. Kennedy Airport (JFK).
| Airline | Airport Pair | Countries | Total Revenue US$ 2018/19 |
|---|---|---|---|
| British Airways | JFK-LHR | 🇺🇸🇬🇧 | $1,159,126,794 |
| Qantas Airlines | MEL-SYD | 🇦🇺 | $849,260,322 |
| Emirates | LHR-DXB | 🇬🇧🇦🇪 | $796,201,645 |
| Singapore Airlines | LHR-SIN | 🇬🇧🇸🇬 | $735,597,614 |
| United Airlines | SFO-EWR | 🇺🇸 | $689,371,368 |
| American Airlines | LAX-JFK | 🇺🇸 | $661,739,368 |
| Qatar Airways | LHR-DOH | 🇬🇧🇶🇦 | $639,122,609 |
| Cathay Pacific Airways | HKG-LHR | 🇭🇰🇬🇧 | $604,595,063 |
| Singapore Airlines | SYD-SIN | 🇦🇺🇸🇬 | $549,711,946 |
| Air Canada | YVR-YYZ | 🇨🇦 | $541,122,509 |
Air Canada’s route between Vancouver and Toronto bottoms out the list with $541 million of revenue in 2019. Low population density, high infrastructure costs, and an aviation industry that is essentially an oligopoly, are all factors driving up ticket costs in Canada.
North America, Top 10 Highest Revenue Routes by Airline
Here’s a look at only the top-grossing routes connected to North America, including the prior ones that made the global list.
| Airline | Airport Pair | Countries | Total Revenue US$ 2018/19 |
|---|---|---|---|
| British Airways | JFK-LHR | 🇺🇸🇬🇧 | $1,159,126,794 |
| United Airlines | SFO-EWR | 🇺🇸 | $689,371,368 |
| American Airlines | LAX-JFK | 🇺🇸 | $661,739,788 |
| Air Canada | YVR-YYZ | 🇨🇦 | $541,122,509 |
| British Airways | BOS-LHR | 🇺🇸🇬🇧 | $523,527,241 |
| Air France | JFK-CDG | 🇺🇸🇫🇷 | $486,378,698 |
| United Airlines | LAX-EWR | 🇺🇸 | $479,908,312 |
| Cathay Pacific Airways | JFK-HKG | 🇺🇸🇭🇰 | $475,514,451 |
| Delta Air Lines | LAX-JFK | 🇺🇸 | $465,130,366 |
| British Airways | LAX-LHR | 🇺🇸🇬🇧 | $452,136,502 |
Transcontinental routes dominate the domestic market with LAX–JFK appearing twice in the ranking for both American and Delta Air Lines.
Asia, Top 10 Highest Revenue Routes by Airline
Despite Asia’s rise as an economic superpower, there are no routes that break the billion dollar barrier. Singapore Airlines’ Singapore (SIN) to London’s Heathrow (LHR) tops the list, generating $736 million in 2019.
| Airline | Airport Pair | Countries | Total Revenue US$ 2018/19 |
|---|---|---|---|
| Singapore Airlines | SIN-LHR | 🇸🇬🇬🇧 | $735,597,614 |
| Cathay Pacific Airlines | HKG-LHR | 🇭🇰🇬🇧 | $604,595,063 |
| Singapore Airlines | SIN-SYD | 🇸🇬🇦🇺 | $549,711,946 |
| Vietnam Airlines | SGN-HAN | 🇻🇳 | $488,487,259 |
| Cathay Pacific Airlines | HKG-JFK | 🇭🇰🇺🇸 | $475,514,451 |
| Japan Airlines | OKA-HND | 🇯🇵 | $447,224,346 |
| Singapore Airlines | CGK-SIN | 🇮🇩🇸🇬 | $436,905,694 |
| Japan Airlines | FUK-HND | 🇯🇵 | $431,457,469 |
| Singapore Airlines | SIN-MEL | 🇸🇬🇦🇺 | $414,276,407 |
| Cathay Pacific Airlines | HKG-SIN | 🇭🇰🇸🇬 | $389,910,239 |
The routes that dominate Asia connect the financial hubs of London, New York, Singapore, and Hong Kong. There are also two domestic routes in Japan, connecting both Fukuoka (FUK) and Okinawa (OKA) to Tokyo’s Haneda (HND) airport.
Africa, Top 10 Highest Revenue Routes by Airline
At the top of the ranking in Africa is Johannesburg (JNB) to Dubai International Airport (DXB) with revenues of $315 million. Dubai has become an important hub for high value flights arriving and departing Africa, a position that may prove profitable as air traffic on the continent increases in coming years.
| Airline | Airport Pair | Countries | Total Revenue US$ 2018/19 |
|---|---|---|---|
| Emirates | JNB-DXB | 🇿🇦🇦🇪 | $315,678,326 |
| British Airways | JNB-LHR | 🇿🇦🇬🇧 | $295,167,492 |
| Saudi Arabian Airlines | CAI-JED | 🇪🇬🇸🇦 | $242,155,949 |
| TAAG Angola Airlines | LAD-LIS | 🇦🇴🇵🇹 | $231,155,949 |
| South African Airlines | JNB-CPT | 🇿🇦 | $184,944,128 |
| Emirates | CAI-DXB | 🇪🇬🇦🇪 | $181,392,011 |
| Emirates | CPT-DXB | 🇿🇦🇦🇪 | $176,743,498 |
| Air France | ABJ-CDG | 🇨🇮🇫🇷 | $174,986,272 |
| British Airways | CPT-LHR | 🇿🇦🇬🇧 | $174,605,201 |
| Emirates | MRU-DXB | 🇲🇺🇦🇪 | $163,952,609 |
Despite the smaller earnings compared to larger markets, some airline companies see the potential for growth in Africa. Virgin Atlantic will fly a route between London’s Heathrow and Cape Town in South Africa, while Qatar Airlines acquired a stake in RwandAir.
Financial Hubs
The cities that appear in the top revenue ranking are revealing. Since business and first class travelers are such an important revenue driver, it makes sense that connections between the world’s financial hubs are delivering big value to airlines.
As Asian and African economies continue to evolve, what route could be the next billion dollar route for airlines?


Brands
How Tech Logos Have Evolved Over Time
From complete overhauls to more subtle tweaks, these tech logos have had quite a journey. Featuring: Google, Apple, and more.


How Tech Logos Have Evolved Over Time
This was originally posted on our Voronoi app. Download the app for free on iOS or Android and discover incredible data-driven charts from a variety of trusted sources.
One would be hard-pressed to find a company that has never changed its logo. Granted, some brands—like Rolex, IBM, and Coca-Cola—tend to just have more minimalistic updates. But other companies undergo an entire identity change, thus necessitating a full overhaul.
In this graphic, we visualized the evolution of prominent tech companies’ logos over time. All of these brands ranked highly in a Q1 2024 YouGov study of America’s most famous tech brands. The logo changes are sourced from 1000logos.net.
How Many Times Has Google Changed Its Logo?
Google and Facebook share a 98% fame rating according to YouGov. But while Facebook’s rise was captured in The Social Network (2010), Google’s history tends to be a little less lionized in popular culture.
For example, Google was initially called “Backrub” because it analyzed “back links” to understand how important a website was. Since its founding, Google has undergone eight logo changes, finally settling on its current one in 2015.
| Company | Number of Logo Changes |
|---|---|
| 8 | |
| HP | 8 |
| Amazon | 6 |
| Microsoft | 6 |
| Samsung | 6 |
| Apple | 5* |
Note: *Includes color changes. Source: 1000Logos.net
Another fun origin story is Microsoft, which started off as Traf-O-Data, a traffic counter reading company that generated reports for traffic engineers. By 1975, the company was renamed. But it wasn’t until 2012 that Microsoft put the iconic Windows logo—still the most popular desktop operating system—alongside its name.
And then there’s Samsung, which started as a grocery trading store in 1938. Its pivot to electronics started in the 1970s with black and white television sets. For 55 years, the company kept some form of stars from its first logo, until 1993, when the iconic encircled blue Samsung logo debuted.
Finally, Apple’s first logo in 1976 featured Isaac Newton reading under a tree—moments before an apple fell on his head. Two years later, the iconic bitten apple logo would be designed at Steve Jobs’ behest, and it would take another two decades for it to go monochrome.

-

 Debt1 week ago
How Debt-to-GDP Ratios Have Changed Since 2000
-

 Markets2 weeks ago
Ranked: The World’s Top Flight Routes, by Revenue
-

 Demographics2 weeks ago
Population Projections: The World’s 6 Largest Countries in 2075
-

 Markets2 weeks ago
The Top 10 States by Real GDP Growth in 2023
-

 Demographics2 weeks ago
The Smallest Gender Wage Gaps in OECD Countries
-

 United States2 weeks ago
Where U.S. Inflation Hit the Hardest in March 2024
-

 Green2 weeks ago
Top Countries By Forest Growth Since 2001
-

 United States2 weeks ago
Ranked: The Largest U.S. Corporations by Number of Employees