Misc
Visualizing the U.S. Airports with the Worst Flight Delays
Visualizing the U.S. Airports with the Worst Flight Delays
They say good things come to those who wait. In the case of flight passengers, however, some may be waiting much longer than others.
With frequent flights comes frequent problems. Unexpected travel irritations, delays, and cancellations are all common issues faced by flyers the world over. Correspondingly, certain airports have developed a reputation for making their passengers wait.
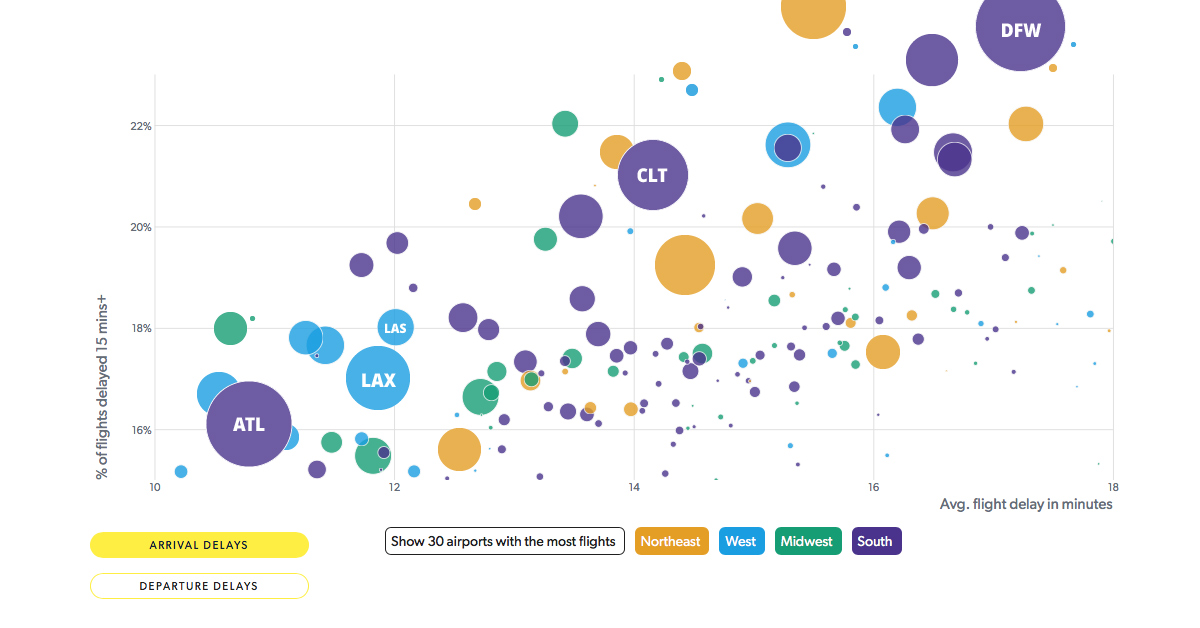
Today’s interactive chart from USAFacts shows the percentage of flights delayed, as well as the average length of those delays, at U.S. airports between October 2018 and September 2019.
The Top 10 Airports With the Longest Delays
In the worst airports across the country, over 25% of all flights get delayed. Here is a list of the top offenders based on percentage of flights delayed and the average delay, according to flight data.
| Rank | City | Airport | Percent of Flights Arriving Late | Average Delay Across Flights |
|---|---|---|---|---|
| #1 | Newark | Newark Liberty International | 26.5% | 22 minutes |
| #2 | New York | LaGuardia | 24.5% | 19.6 minutes |
| #3 | Chicago | Chicago O'Hare International | 25.5% | 19.2 minutes |
| #4 | Boston | Logan International | 22% | 17.3 minutes |
| #5 | Dallas | Dallas/Fort Worth International | 23.3% | 16.5 minutes |
| #6 | San Francisco | San Francisco International | 22.4% | 16.2 minutes |
| #7 | Fort Lauderdale | Fort Lauderdale-Hollywood International | 21.9% | 16.3 minutes |
| #8 | Denver | Denver International | 21.6% | 15.3 minutes |
| #9 | Miami | Miami International | 21.6% | 15.3 minutes |
| #10 | Chicago | Chicago Midway | 22% | 13.4 minutes |
Newark Liberty International takes the top spot, with 26.5% of all flights taking off late. To make matters worse, it also had the longest average delay time, at 22 minutes per flight. The runner-up is another New York-based airport, LaGuardia, averaging close to 20 minutes per flight delay.
The third worst offender was Chicago O’Hare International airport, where over a quarter of flights arrived late, with an average delay of 19 minutes. Chicago O’Hare International saw more flights than Newark and LaGuardia combined, making average delays more costly.
What’s Behind These Major Flight Delays?
While the New York area hosts two of the worst airports in the country, flight delays are exacerbated by a number of regional factors.
First, it hosts one of the busiest air corridors worldwide. As a result, any unexpected interruption or delay has an outsized effect on flights arriving at their destination on time.
Coupled with this is the commanding presence of United Airlines. As one of the largest airlines in the world, it operates over 401 daily flights at Newark airport. Additionally, United has been known to have operational issues. For example, in June 2019, significant aircraft problems led the Newark airport to suspend flights altogether.
There are four major causes of flight delays: poor weather conditions, late aircraft, carrier related (such as baggage, fueling, or maintenance problems), and airspace system issues.
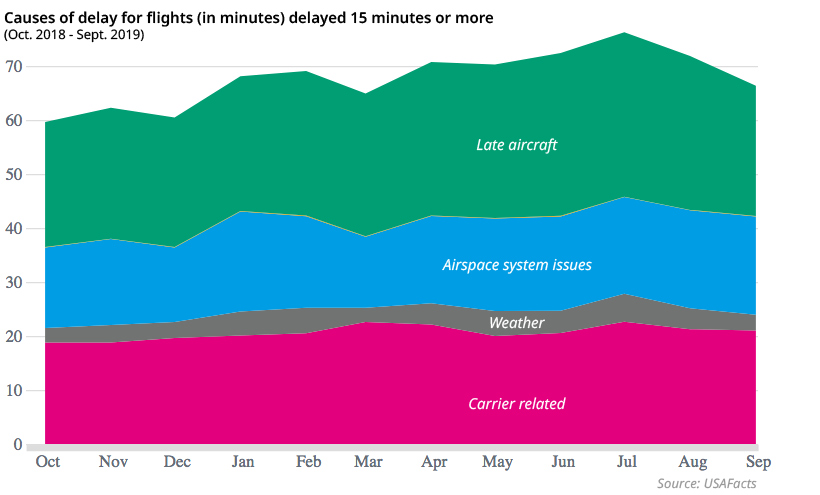
According to this data, it’s clear that late aircraft is the most prevalent cause for flight delays that ended up being longer than 15 minutes.
Late aircraft creates a domino effect: when an airplane arrives late at an airport, a following flight that uses the same aircraft will depart behind schedule. In peak months such as July, this contributes to nearly 50% of flight delays.
Worst Months of the Year to Fly
The number of flights on U.S. airlines has more than tripled, from 275 million flights in 1978 to 889 million in 2018.
Along with this, flight activity is typically highest in the summer—coinciding with July’s highest average flight delay of 76 minutes. Months in the summer followed suit, with June averaging 72 minutes per delay and August having an average delay of 71 minutes, among flights that were delayed over 15 minutes.
| Month | Rank | Average Delay (in minutes) |
|---|---|---|
| July | 1 | 76 |
| June | 2 | 72 |
| August | 3 | 71 |
| April | 4 | 71 |
| May | 5 | 70 |
| February | 6 | 69 |
| January | 7 | 68 |
| September | 8 | 67 |
| March | 9 | 65 |
| November | 10 | 62 |
| December | 11 | 60 |
| October | 12 | 59 |
Perhaps surprisingly, flights in December bucked this trend. Even as a flight-heavy month, average long delays hovered around 60 minutes during the holiday season.
The 10 U.S. Airports with the Fewest Delays
By comparison, a number of airports appear to have avoided this trap. Data below shows the top airports in the U.S. with the fewest flight delays during the same time period.
| Rank | City | Airport | Percent of Flights Arriving Late | Average Delay Across Flights |
|---|---|---|---|---|
| #1 | Honolulu | Daniel K Inouye International | 10.5% | 6.8 minutes |
| #2 | Anchorage | Ted Stevens Anchorage International | 11% | 7.1 minutes |
| #3 | Lihue | Lihue Airport | 10.1% | 7.7 minutes |
| #4 | Long Beach | Long Beach Airport | 12.6% | 8.4 minutes |
| #5 | Sacramento | Sacramento International | 14% | 8.6 minutes |
| #6 | Kahului | Kahului Airport | 12.7% | 8.9 minutes |
| #7 | Portland | Portland International | 13.8% | 9 minutes |
| #8 | San Jose | Norman Y. Mineta San Jose International | 14.9% | 9.2 minutes |
| #9 | Salt Lake City | Salt Lake City International | 13.3% | 9.7 minutes |
| #10 | Santa Ana | John Wayne Airport-Orange County | 14.7% | 9.8 minutes |
As the volume of air travel continues to climb, it is clear that some airports underperform others by a wide margin. To break the vicious cycle of delays, it will be vital for airports to get initial flights departing on time in the first place.


Misc
How Hard Is It to Get Into an Ivy League School?
We detail the admission rates and average annual cost for Ivy League schools, as well as the median SAT scores required to be accepted.


How Hard Is It to Get Into an Ivy League School?
This was originally posted on our Voronoi app. Download the app for free on iOS or Android and discover incredible data-driven charts from a variety of trusted sources.
Ivy League institutions are renowned worldwide for their academic excellence and long-standing traditions. But how hard is it to get into one of the top universities in the U.S.?
In this graphic, we detail the admission rates and average annual cost for Ivy League schools, as well as the median SAT scores required to be accepted. The data comes from the National Center for Education Statistics and was compiled by 24/7 Wall St.
Note that “average annual cost” represents the net price a student pays after subtracting the average value of grants and/or scholarships received.
Harvard is the Most Selective
The SAT is a standardized test commonly used for college admissions in the United States. It’s taken by high school juniors and seniors to assess their readiness for college-level academic work.
When comparing SAT scores, Harvard and Dartmouth are among the most challenging universities to gain admission to. The median SAT scores for their students are 760 for reading and writing and 790 for math. Still, Harvard has half the admission rate (3.2%) compared to Dartmouth (6.4%).
| School | Admission rate (%) | SAT Score: Reading & Writing | SAT Score: Math | Avg Annual Cost* |
|---|---|---|---|---|
| Harvard University | 3.2 | 760 | 790 | $13,259 |
| Columbia University | 3.9 | 750 | 780 | $12,836 |
| Yale University | 4.6 | 760 | 780 | $16,341 |
| Brown University | 5.1 | 760 | 780 | $26,308 |
| Princeton University | 5.7 | 760 | 780 | $11,080 |
| Dartmouth College | 6.4 | 760 | 790 | $33,023 |
| University of Pennsylvania | 6.5 | 750 | 790 | $14,851 |
| Cornell University | 7.5 | 750 | 780 | $29,011 |
*Costs after receiving federal financial aid.
Additionally, Dartmouth has the highest average annual cost at $33,000. Princeton has the lowest at $11,100.
While student debt has surged in the United States in recent years, hitting $1.73 trillion in 2023, the worth of obtaining a degree from any of the schools listed surpasses mere academics. This is evidenced by the substantial incomes earned by former students.
Harvard grads, for example, have the highest average starting salary in the country, at $91,700.

-

 Real Estate2 weeks ago
Visualizing America’s Shortage of Affordable Homes
-

 Technology1 week ago
Ranked: Semiconductor Companies by Industry Revenue Share
-

 Money1 week ago
Which States Have the Highest Minimum Wage in America?
-

 Real Estate1 week ago
Ranked: The Most Valuable Housing Markets in America
-

 Business2 weeks ago
Charted: Big Four Market Share by S&P 500 Audits
-

 AI2 weeks ago
The Stock Performance of U.S. Chipmakers So Far in 2024
-

 Misc2 weeks ago
Almost Every EV Stock is Down After Q1 2024
-

 Money2 weeks ago
Where Does One U.S. Tax Dollar Go?