

In this graphic, we show the highest earning flight routes globally as air travel continued to rebound in 2023.


The most powerful passports have changed over the last decade, driven by political and economic factors. Here are the top 30 worldwide.


Which countries have the least powerful passports? Here's how economic strength and political factors impact travel freedom in 2024.
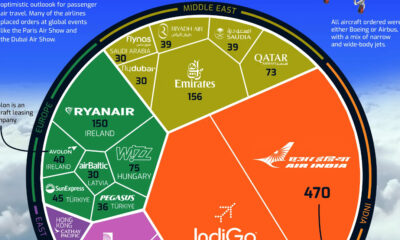

Commercial jet purchases boomed in 2023. Here are the top airlines that ordered aircraft amid surging travel demand last year.


Fueled by powerful social and technological megatrends, travel & tourism has grown exponentially and in 2022 made up 7.6% of global GDP.
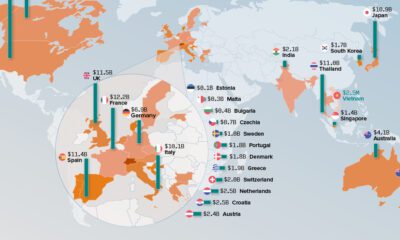

Between 2019 and 2021, consumers enjoyed over $158 billion in combined savings because of the economic impact of online travel agencies.

Accommodations account for an estimated 264 million tonnes CO2-eq in annual emissions and the sector has an ambitious plan to reach net zero.


This infographic highlights the 10 cities where international travelers spend the most. In 2022, Dubai took top spot.
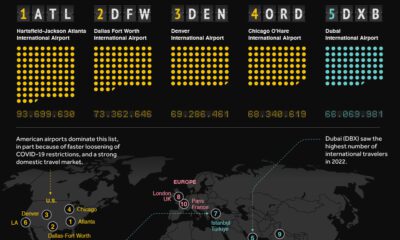

From Dubai to Charles de Gaulle, this visual ranks the world's busiest airports in terms of passenger count.


With the travel and tourism industry committing to halving carbon emissions by 2030, net zero hotels could be here sooner than you think.


 Creator Program