From complete overhauls to more subtle tweaks, these tech logos have had quite a journey. Featuring: Google, Apple, and more.


In this graphic we rank the top Swiss watch brands, based on their estimated 2023 market share.


Ramadan is the ninth month of the Islamic calendar, observed by Muslims worldwide as a month of fasting, prayer, reflection, and community.


This graphic visualizes the most valuable brands by country in 12 major economies, from tech and energy giants to automakers and banks.
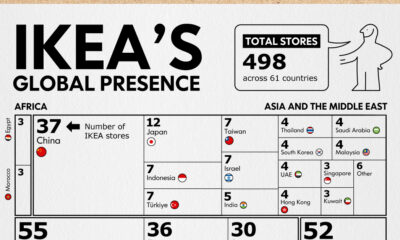

Known for their size, labyrinth-like layouts, food, and of course, functional furniture, IKEA stores have become a whole shopping experience. But which country has the most...
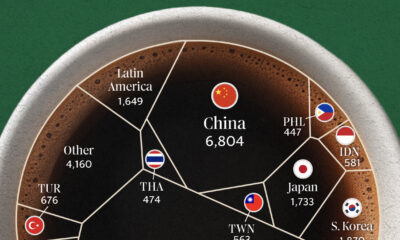

Starbucks has nearly 40,000 stores in 80 different countries? But which countries account for the lion's share of them?


What are Gen Z's favorite brands? Here are the top 5 brands for apparel, footwear, and handbags, according to U.S. teens in September 2023.
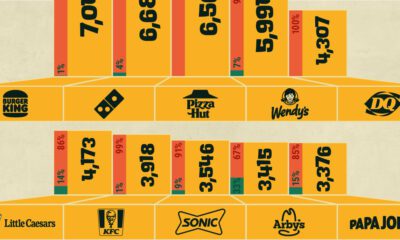

An overview of America’s fast food landscape, as of 2022, visualizing the top fast food brands with the most stores in the country.
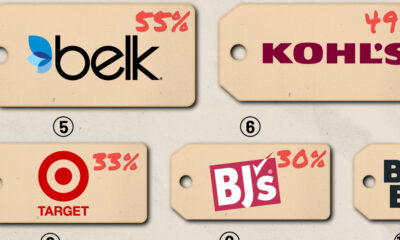

To compile this list, WalletHub analyzed over 3,500 deals from 13 U.S. retailers to calculate their average black Friday discounts for 2023.


Considering factors like the cost of investment and number of locations, this graphic breaks down the best franchises in the U.S.


