Misc
Can a Shorter Workweek Make People Happier?


Can A Shorter Workweek Make People Happier?
For many people, the concept of a shorter workweek is enticing. After all, it can be difficult to find enough time for the things we love.
Is it reasonable then, in our quest for happiness, to begin working less? Advocates of a shorter workweek would agree, but these policies have yet to be widely-adopted.
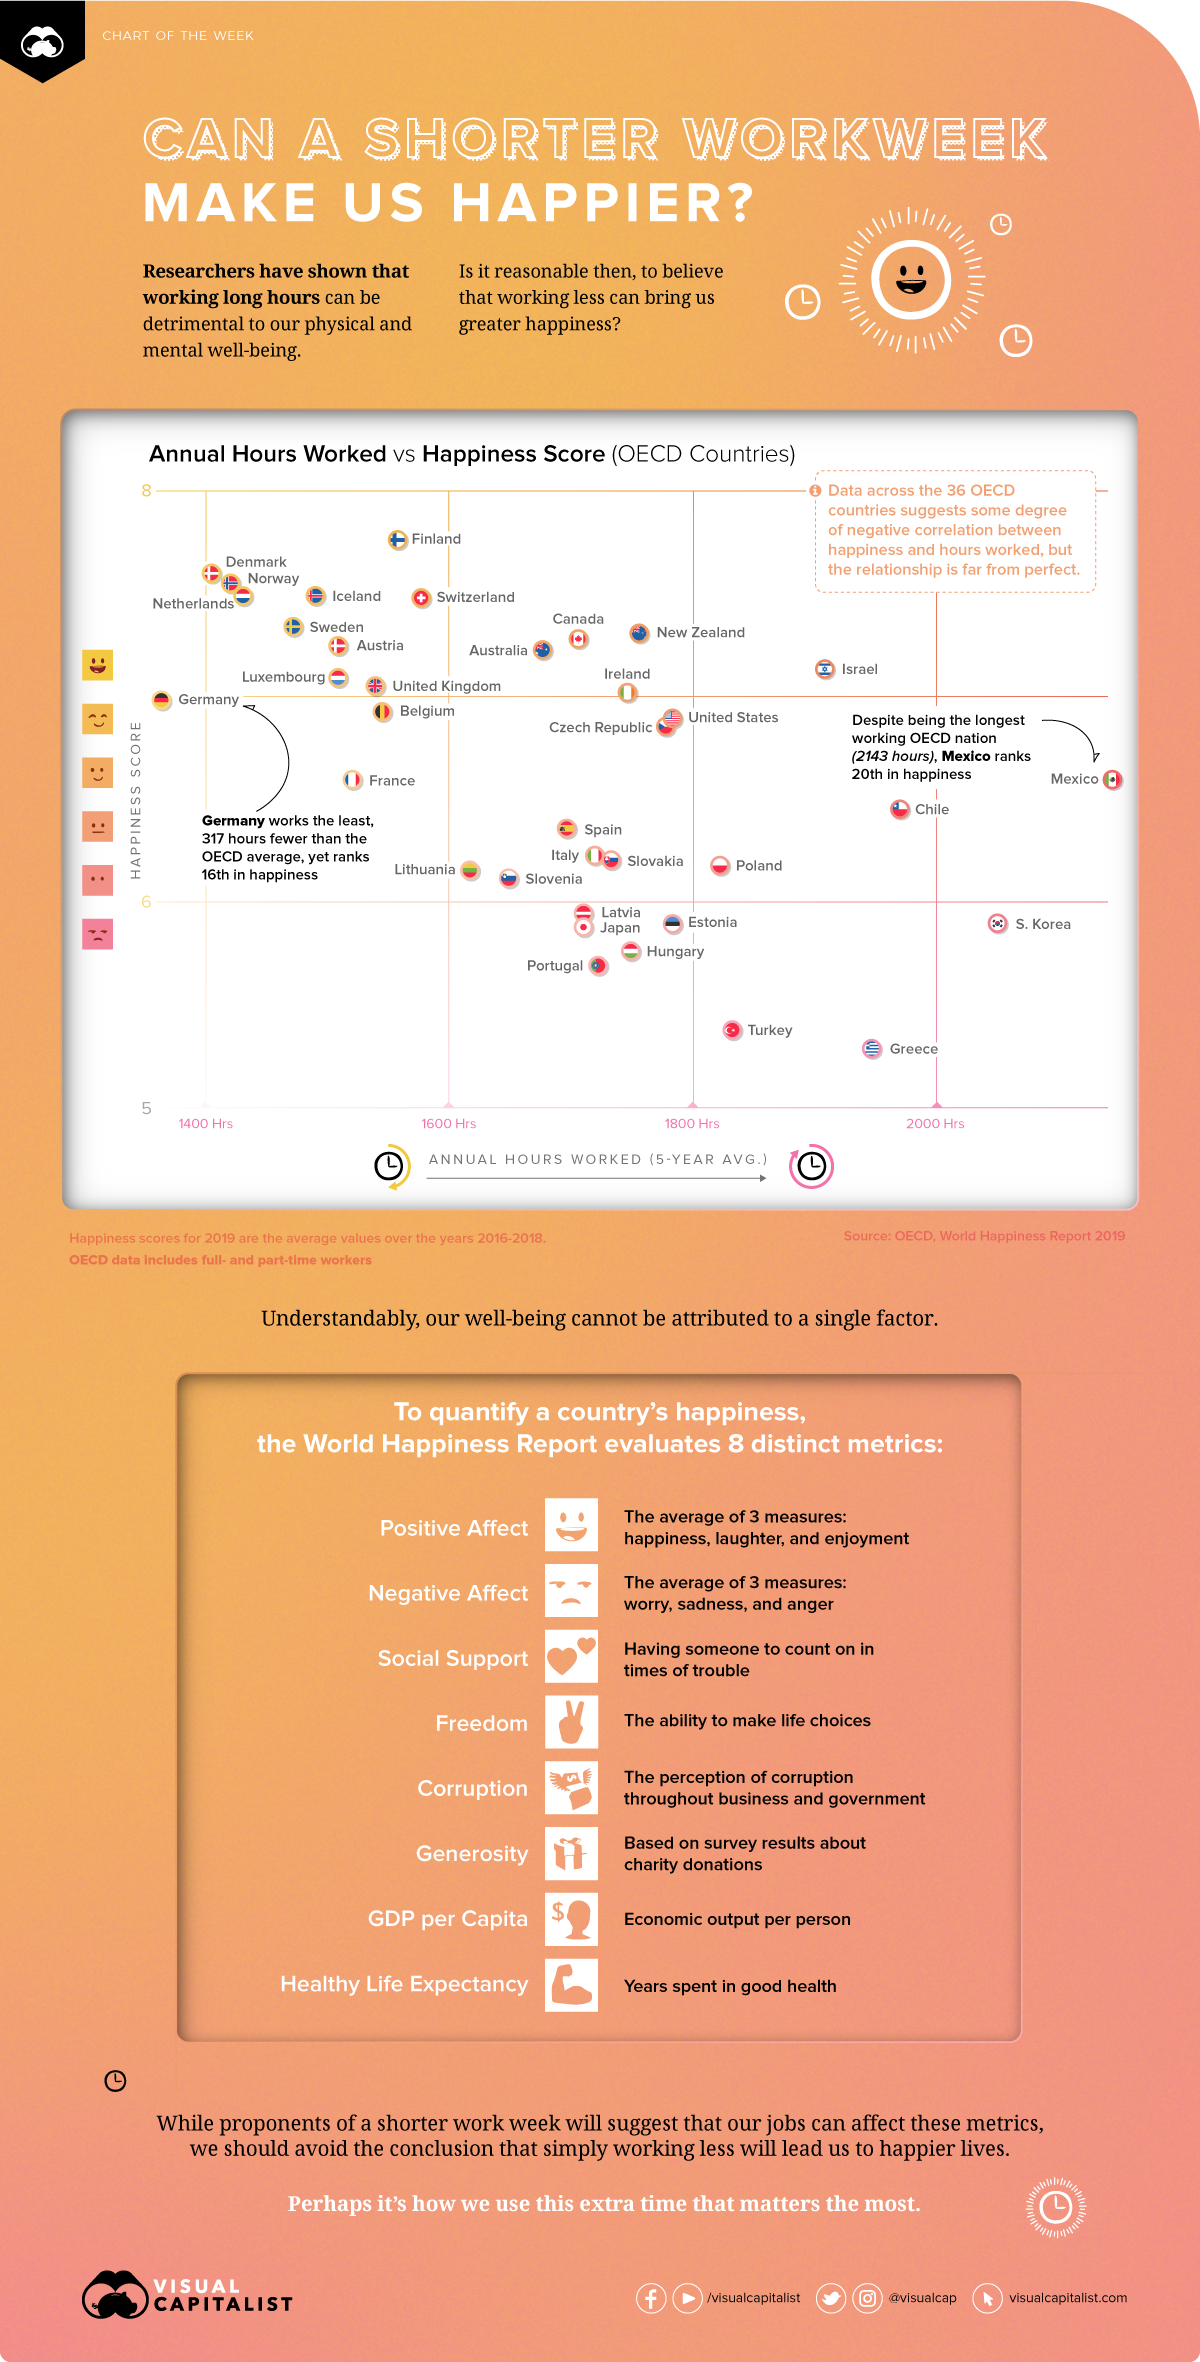
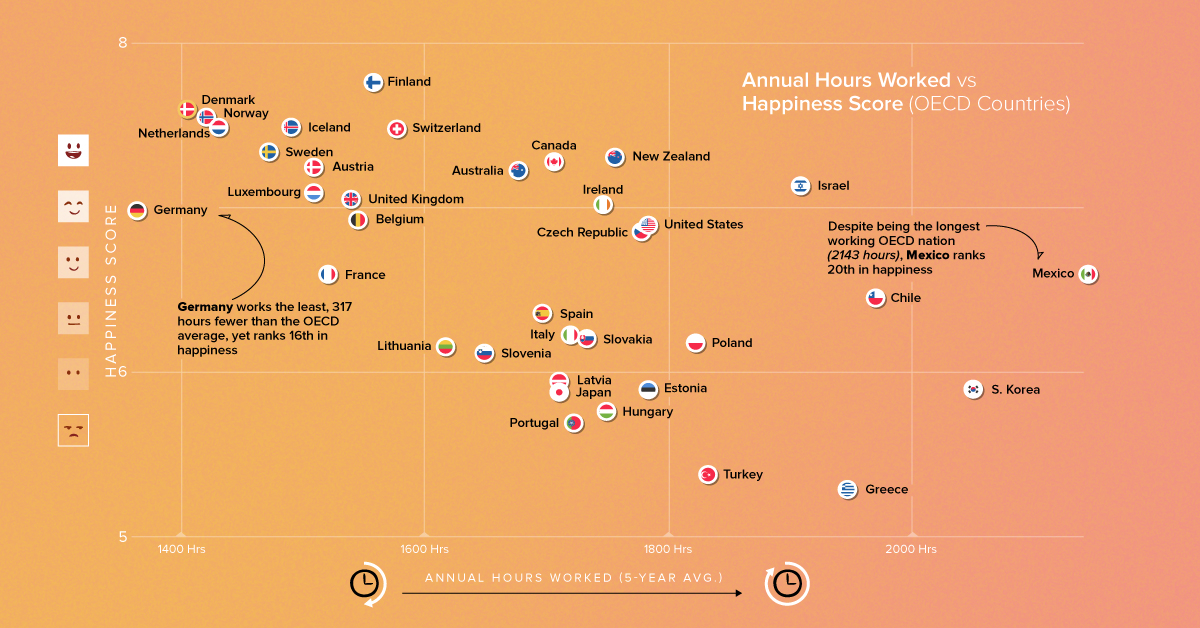
Today’s chart plots data from the World Happiness Report 2019 and the OECD to determine if there’s any correlation between a country’s happiness and average hours worked per person.
What Happens When We Work Too Much?
The unhealthy side effects of working long hours are well established. In extreme cases, however, symptoms can extend beyond the usual stress and fatigue.
For example, the American Heart Association found that people under the age of 50 had a higher risk of stroke when working over 10 hours a day for a decade or more. Another study, conducted across 14 countries, concluded that people who worked long hours were 12% more likely to become excessive drinkers.
If working longer days is so harmful to our well-being, what happens if we work fewer hours instead?
Comparing the Numbers
The tables below list the happiest countries as well as the unhappiest countries in the OECD; happiness scores range from 0 to 10, with a 10 representing the best life possible.
Based on the data, there appears to be some degree of correlation between a person’s happiness and the amount of hours they work.
Here’s how the five happiest countries stack up:
| Country | Happiness Score (0-10) | 5-Yr Average Annual Hours Worked | Difference in Hours Worked from OECD Average (1,682 hrs) |
|---|---|---|---|
| 🇫🇮 Finland | 7.769 | 1,559 hrs | -123 hrs |
| 🇩🇰 Denmark | 7.600 | 1,406 hrs | -276 hrs |
| 🇳🇴 Norway | 7.554 | 1,422 hrs | -260 hrs |
| 🇮🇸 Iceland | 7.494 | 1,491 hrs | -191 hrs |
| 🇳🇱 Netherlands | 7.488 | 1,432 hrs | -250 hrs |
The five happiest countries each work over 100 hours less than the OECD average. Compare this to the five least happiest countries:
| Country | Happiness Score (0-10) | 5-Yr Average Annual Hours Worked | Difference in Hours Worked from OECD Average (1,682 hrs) |
|---|---|---|---|
| 🇬🇷 Greece | 5.287 | 1,946 hrs | +264 hrs |
| 🇹🇷 Turkey | 5.373 | 1,832 hrs | +150 hrs |
| 🇵🇹 Portugal | 5.693 | 1,722 hrs | +40 hrs |
| 🇭🇺 Hungary | 5.758 | 1,749 hrs | +67 hrs |
| 🇯🇵 Japan | 5.886 | 1,710 hrs* | +28 hrs |
*OECD data includes full- and part-time workers. While this affects the entire data set, Japan’s high share of part-time workers (37% as of 2017) suggests it is particularly vulnerable to underestimation.
Coincidentally, all five of the least happiest countries work more hours than the OECD average, up to over 264 hours in the case of Greece.
Happiness is multifaceted, though, and we should avoid drawing conclusions from a single variable. For instance, the World Happiness Report 2019 calculates happiness scores based on eight distinct metrics:
| Metric | Description | |
|---|---|---|
| #1 | Positive Affect | The average of 3 measures: happiness, laughter, and enjoyment |
| #2 | Negative Affect | The average of 3 measures: worry, sadness, and anger |
| #3 | Social Support | Having someone to count on in times of trouble |
| #4 | Freedom | The ability to make life choices |
| #5 | Corruption | The perception of corruption throughout business and government |
| #6 | Generosity | Based on survey results about charity donations |
| #7 | GDP per Capita (Log Scale) | Economic output per person |
| #8 | Healthy Life Expectancy | Years spent in good health |
With these in mind, we can make a few additional observations.
Four of the five happiest OECD countries are located in the Nordics, a region known for low corruption rates and robust social safety nets. On the other end of the scale, economic hardship is a recurring theme among the OECD’s least happiest countries. The falling Turkish lira and Greece’s debt crisis are two significant examples.
To properly measure the happiness-boosting potential of a shortened workweek, it seems we need to isolate its effects.
Challenging the Status Quo
Employers are now experimenting with shorter work schedules to see if happier employees are in fact better employees.
Case 1: Successful Trial
Perpetual Guardian, a New Zealand-based estate planning firm, trialed a four-day workweek for two months with no changes to compensation.
The trial was hailed as a success. Employee stress levels fell by 7 percentage points while overall life satisfaction rose by 5 percentage points. Perhaps most impressive is the fact that productivity remained the same.
Employees designed a number of innovations and initiatives to work in a more productive and efficient manner.
– Helen Delaney, University of Auckland
Following the trial, the firm’s founder expressed interest in implementing the four-day workweek on a permanent basis.
Case 2: Successful Trial with Trade-offs
Filimundus, a Sweden-based software studio, trialed a six-hour workday in 2014. Staff reception was positive, and the company has since adopted it permanently.
There were trade-offs, however. While staff enjoyed more time for their private lives, productivity across different departments saw mixed results.
We did see some decrease in production for some staff, mostly our artists, but an increase in production for our programmers. So money-wise, in costs, it evened out.
– Linus Feldt, CEO
Interestingly, the studio also trialed a seven-hour workday, and saw no positive effects.
Case 3: An Unsustainable Solution
Public healthcare workers in Gothenburg, Sweden, trialed a six-hour workday for two years. Similar to the first case, compensation was unchanged.
While the trial achieved good results—staff experienced lower stress levels and patients received a higher level of care—the policy was unsustainable.
It’s far too expensive to carry out a general shortening of working hours within a reasonable time frame.
– Daniel Bernmar
17 additional staff were hired to compensate for the shorter workdays, increasing the local government’s payroll by $738,000. The city council did note, however, that lower unemployment costs offset this increase by approximately 10%.
Picking Up Momentum
These experiments are garnering attention from around the world.
Even Japan, a country known for its “overtime culture”, is getting in on the action. Microsoft offices in the East Asian country tested a four-day workweek in August 2019, and reported happier staff, as well as an impressive 40% boost in productivity.
While the results of these early experiments are indeed promising, they’ve exposed the nuances that exist between industries and job types, and the need for further trials. One thing is certain though—shorter workweek policies should not be interpreted as a “one size fits all” solution for happier lives.


VC+
VC+: Get Our Key Takeaways From the IMF’s World Economic Outlook
A sneak preview of the exclusive VC+ Special Dispatch—your shortcut to understanding IMF’s World Economic Outlook report.

Have you read IMF’s latest World Economic Outlook yet? At a daunting 202 pages, we don’t blame you if it’s still on your to-do list.
But don’t worry, you don’t need to read the whole April release, because we’ve already done the hard work for you.
To save you time and effort, the Visual Capitalist team has compiled a visual analysis of everything you need to know from the report—and our VC+ Special Dispatch is available exclusively to VC+ members. All you need to do is log into the VC+ Archive.
If you’re not already subscribed to VC+, make sure you sign up now to access the full analysis of the IMF report, and more (we release similar deep dives every week).
For now, here’s what VC+ members get to see.
Your Shortcut to Understanding IMF’s World Economic Outlook
With long and short-term growth prospects declining for many countries around the world, this Special Dispatch offers a visual analysis of the key figures and takeaways from the IMF’s report including:
- The global decline in economic growth forecasts
- Real GDP growth and inflation forecasts for major nations in 2024
- When interest rate cuts will happen and interest rate forecasts
- How debt-to-GDP ratios have changed since 2000
- And much more!

Get the Full Breakdown in the Next VC+ Special Dispatch
VC+ members can access the full Special Dispatch by logging into the VC+ Archive, where you can also check out previous releases.
Make sure you join VC+ now to see exclusive charts and the full analysis of key takeaways from IMF’s World Economic Outlook.
Don’t miss out. Become a VC+ member today.
What You Get When You Become a VC+ Member
VC+ is Visual Capitalist’s premium subscription. As a member, you’ll get the following:
- Special Dispatches: Deep dive visual briefings on crucial reports and global trends
- Markets This Month: A snappy summary of the state of the markets and what to look out for
- The Trendline: Weekly curation of the best visualizations from across the globe
- Global Forecast Series: Our flagship annual report that covers everything you need to know related to the economy, markets, geopolitics, and the latest tech trends
- VC+ Archive: Hundreds of previously released VC+ briefings and reports that you’ve been missing out on, all in one dedicated hub
You can get all of the above, and more, by joining VC+ today.

-

 Debt1 week ago
How Debt-to-GDP Ratios Have Changed Since 2000
-

 Markets2 weeks ago
Ranked: The World’s Top Flight Routes, by Revenue
-

 Countries2 weeks ago
Population Projections: The World’s 6 Largest Countries in 2075
-

 Markets2 weeks ago
The Top 10 States by Real GDP Growth in 2023
-

 Demographics2 weeks ago
The Smallest Gender Wage Gaps in OECD Countries
-

 United States2 weeks ago
Where U.S. Inflation Hit the Hardest in March 2024
-

 Green2 weeks ago
Top Countries By Forest Growth Since 2001
-

 United States2 weeks ago
Ranked: The Largest U.S. Corporations by Number of Employees