Politics
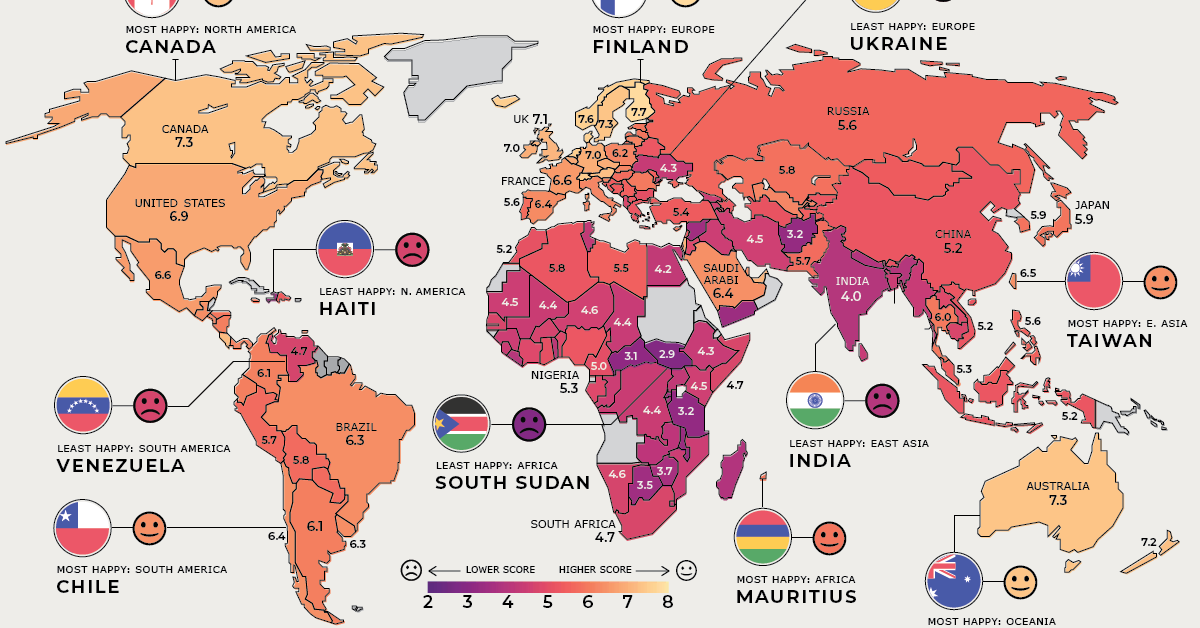
Visualizing the Happiest Country on Every Continent
For the latest update, check out the happiest countries in the world in 2023.
Visualizing the Happiest Country on Every Continent
For the latest update, check out the happiest countries in the world in 2023.
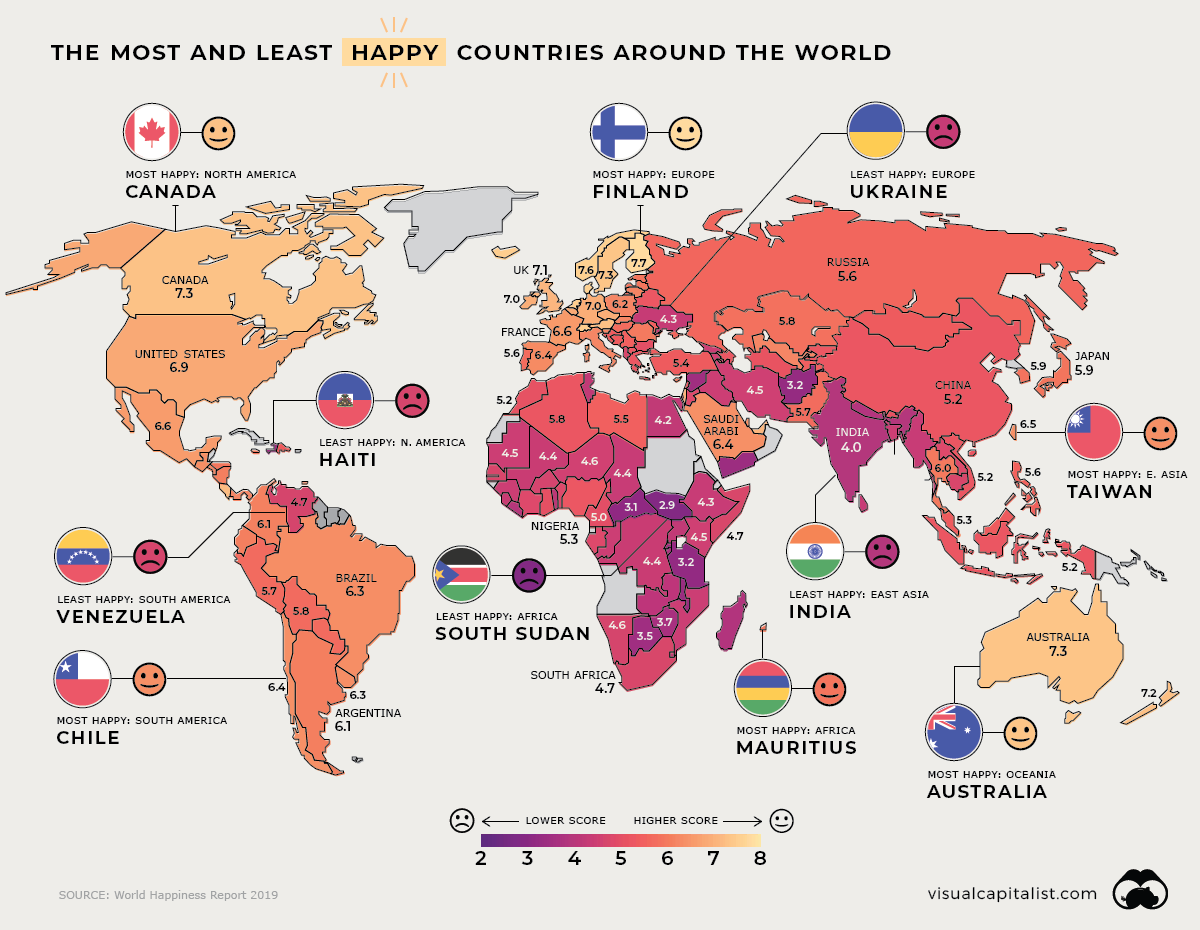
The state of our world is shifting beneath our feet — economics alone no longer equate to satisfaction, let alone happiness.
Today’s visualization pulls data from the seventh World Happiness Report 2019, which ranks 156 countries by their happiness levels. We’ve previously shown the variables used to measure happiness in this report, but here, we break down rankings by continent and region for a clearer picture of where each country lies.
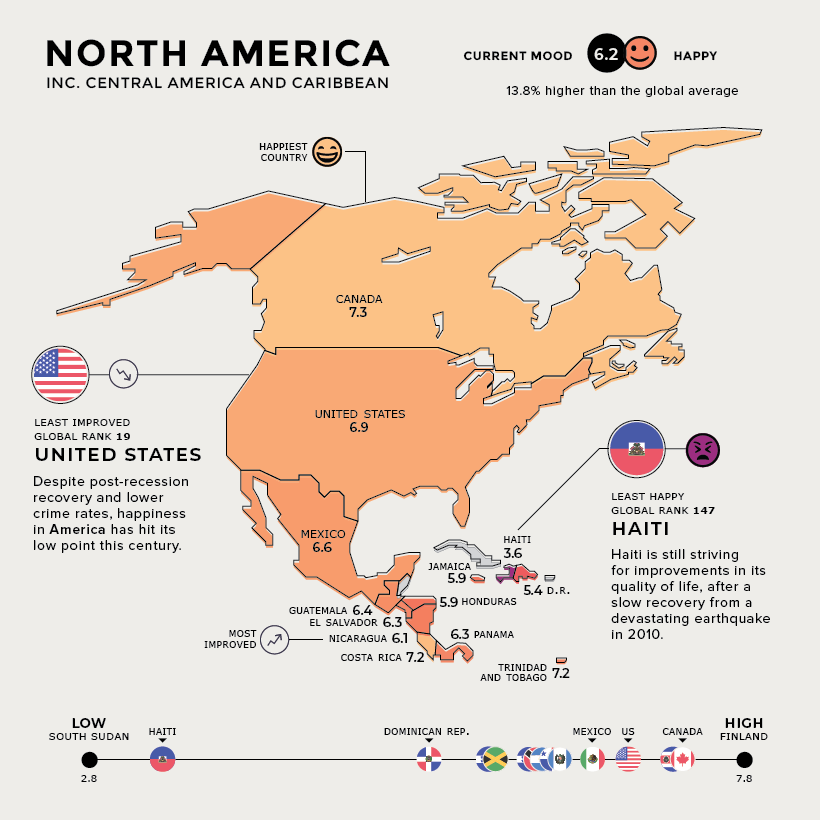
North America
Unhappy Americans have caused the country to tumble in rankings for a third straight year, despite evidence that things are generally looking up. The report attributes much of this erosion to a variety of addictions: opioids, workaholism, gambling, internet, exercise, and even shopping are among them.
Haiti is the least happy country in this region. The country is still struggling to rebuild sanitation infrastructure and other educational and healthcare programs, despite foreign aid.
In brighter news, Nicaragua is seeing great gains in happiness levels, as the country makes a concentrated effort to reduce poverty.
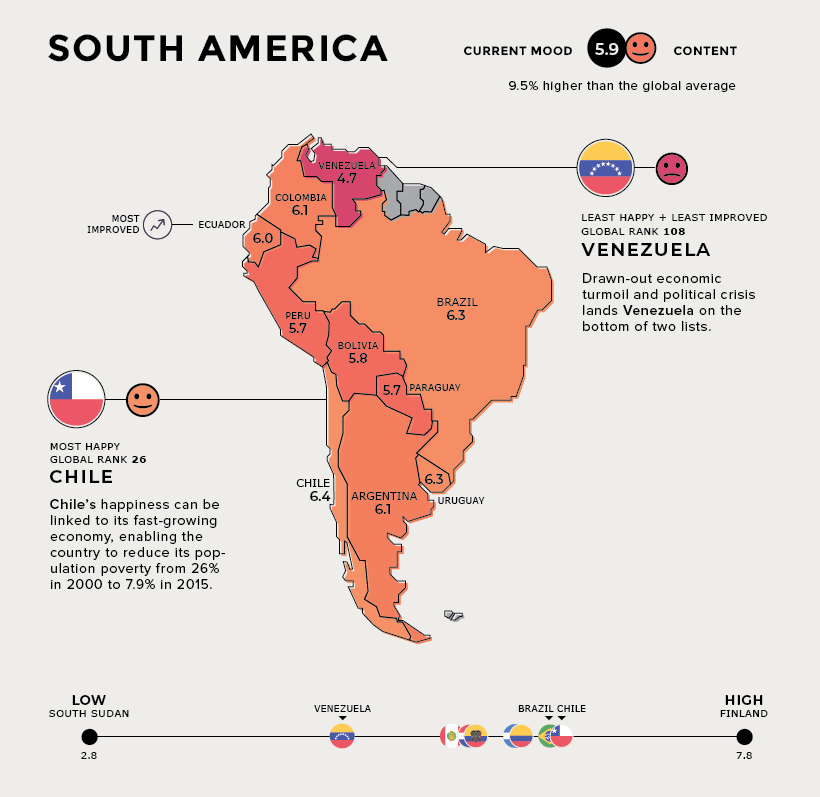
South America
In South America, the majority of countries cluster around a score of six on the happiness scale.
The one notable exception to this is Venezuela, which is faltering in both happiness rank and regional improvement. The nation’s hyperinflation and humanitarian crisis both show no signs of slowing down.
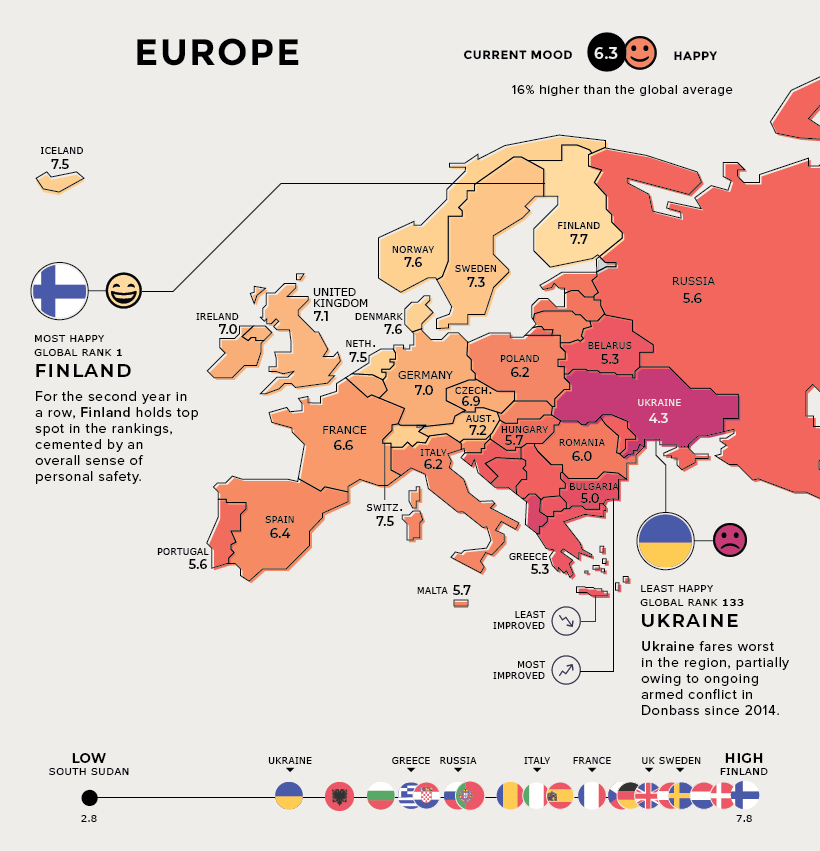
Europe
Finland comes out on top of the world for a second consecutive year, and it’s not difficult to see why. The country boasts a stable work-life balance, bolstered by a comprehensive welfare state.
Scandinavian countries appear among the happiest nations for similar very reasons — elevating the region’s score to 16% above the global average.
On the flip side, Ukraine is the unhappiest, likely intensified by the ongoing war in southeastern Donbass. Greece is the least improved, as it continues to heal from the sovereign debt crisis.
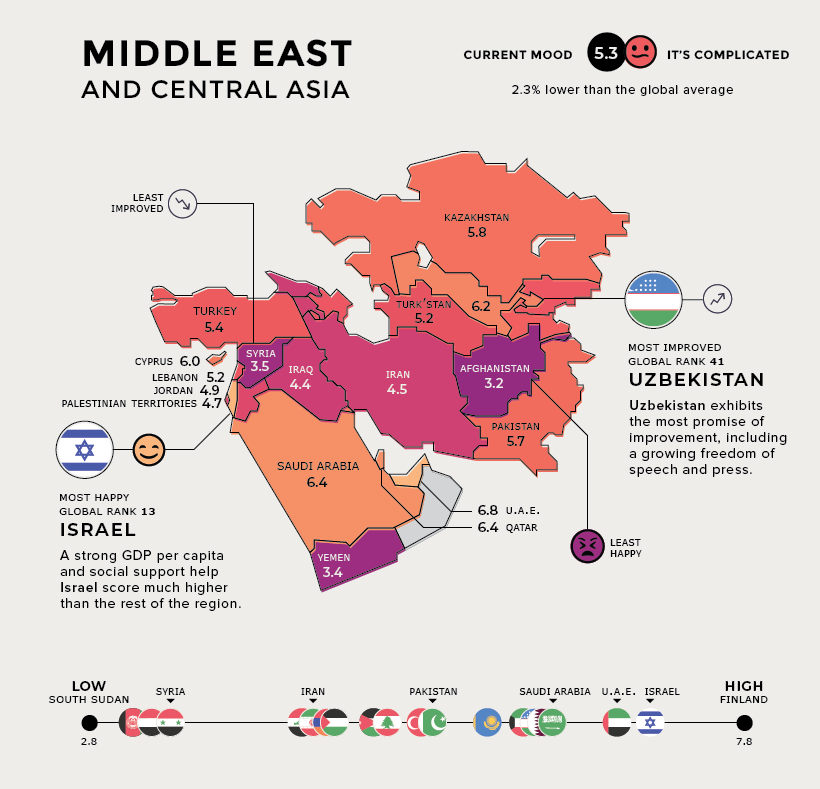
Middle East and Central Asia
Uzbekistan shows the swiftest regional improvement, as the country has launched an ambitious reform agenda for greater economic, social, and political development and openness.
Unfortunately, Syria’s continued civil war comes with a heavy price for its people and economy, as does the Palestinian-Israeli conflict — although the latter doesn’t seem to impact Israel’s happiness ranking. In fact, Israel finished with the 13th best score, globally.
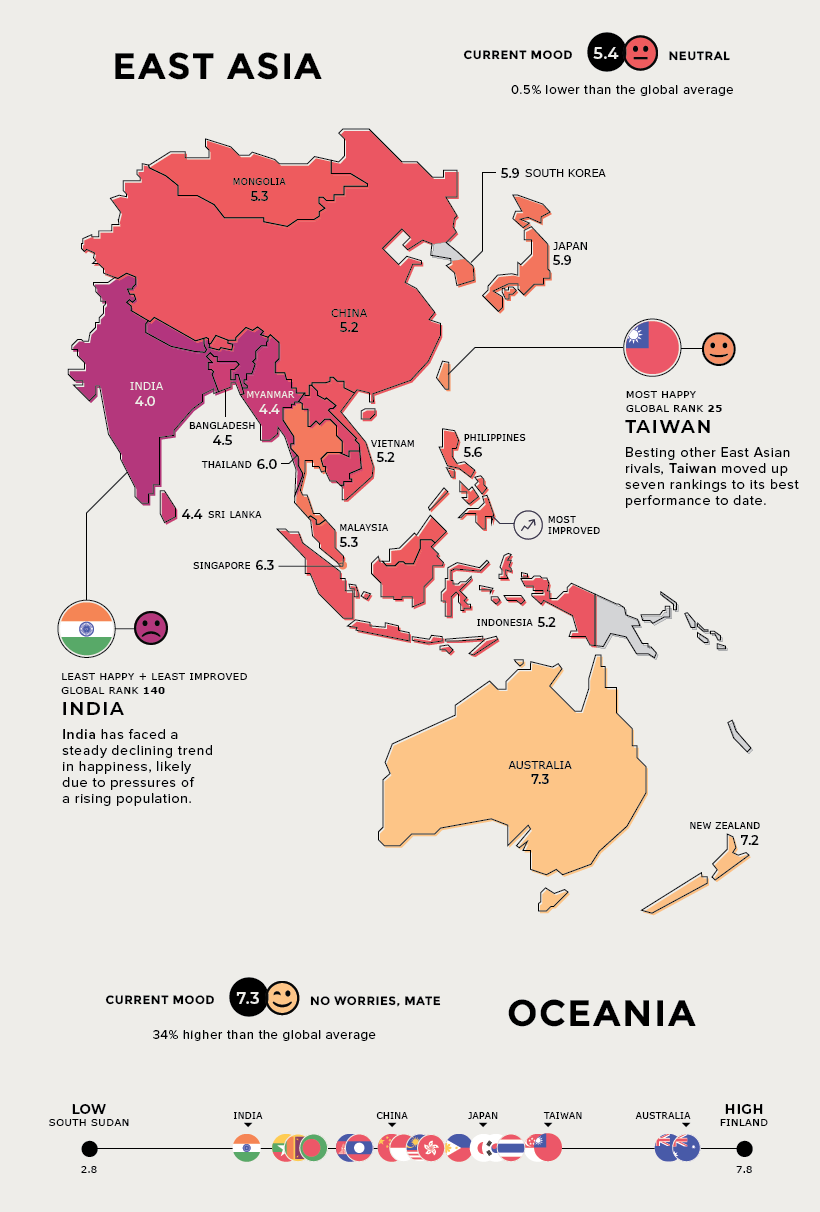
Rest of Asia and Oceania
In East Asia, the average happiness score is quite close to the global average, with Taiwan standing out as the happiest country.
Singapore out-competes other countries within Southeast Asia, despite only being home to a population of 5.6 million. Its neighbor Malaysia, however, plunged from 35th to 80th place.
Oceania stands alone – Australia and New Zealand are closely matched in their individual happiness scores.
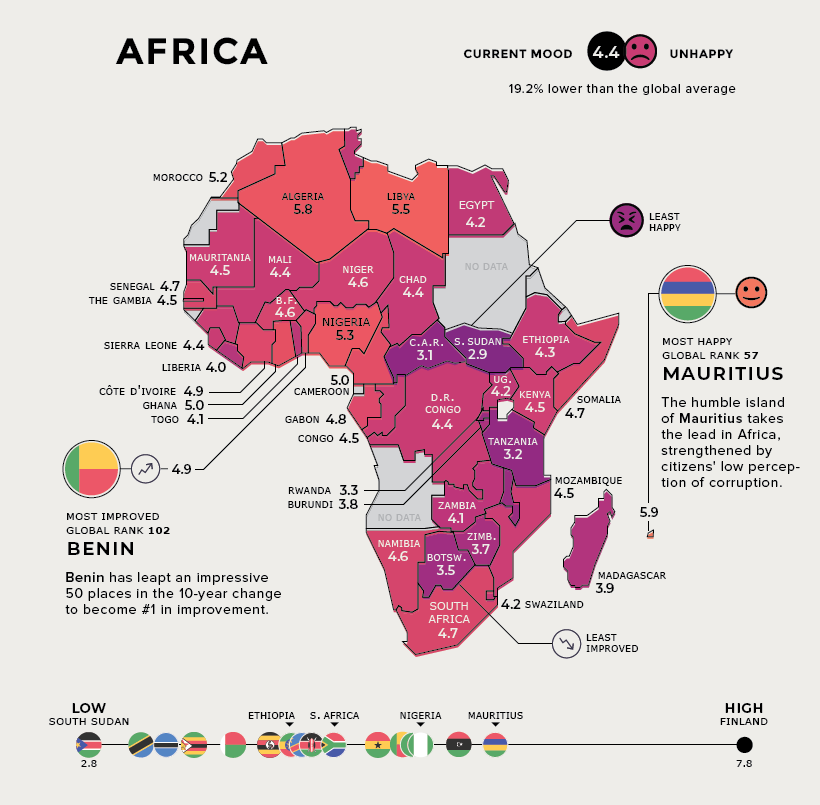
Africa
The African continent as a whole fares 19.2% below the global average. But there are silver linings, with strong strides towards improvement being made.
Mauritius benefits from good governance and a buoyant tourism sector — with visitor arrivals equal to the island’s 1.3 million population. Meanwhile, Benin has soared in the rankings, and is supported by the World Bank in key structural reforms such as poverty reduction and access to basic services.
What could these rankings look like in another ten years?
Notes: The Africa map was updated to show more country scores. The report only covers 156 countries, so “Oceania” only refers to Australia and New Zealand in this instance.


Economy
The Bloc Effect: International Trade with Geopolitical Allies on the Rise
Rising geopolitical tensions are shaping the future of international trade, but what is the effect on trading among G7 and BRICS countries?


The Bloc Effect: International Trade with Allies on the Rise
International trade has become increasingly fragmented over the last five years as countries have shifted to trading more with their geopolitical allies.
This graphic from The Hinrich Foundation, the first in a three-part series covering the future of trade, provides visual context to the growing divide in trade in G7 and pre-expansion BRICS countries, which are used as proxies for geopolitical blocs.
Trade Shifts in G7 and BRICS Countries
This analysis uses IMF data to examine differences in shares of exports within and between trading blocs from 2018 to 2023. For example, we looked at the percentage of China’s exports with other BRICS members as well as with G7 members to see how these proportions shifted in percentage points (pp) over time.
Countries traded nearly $270 billion more with allies in 2023 compared to 2018. This shift came at the expense of trade with rival blocs, which saw a decline of $314 billion.
Country Change in Exports Within Bloc (pp) Change in Exports With Other Bloc (pp)
🇮🇳 India 0.0 3.9
🇷🇺 Russia 0.7 -3.8
🇮🇹 Italy 0.8 -0.7
🇨🇦 Canada 0.9 -0.7
🇫🇷 France 1.0 -1.1
🇪🇺 EU 1.1 -1.5
🇩🇪 Germany 1.4 -2.1
🇿🇦 South Africa 1.5 1.5
🇺🇸 U.S. 1.6 -0.4
🇯🇵 Japan 2.0 -1.7
🇨🇳 China 2.1 -5.2
🇧🇷 Brazil 3.7 -3.3
🇬🇧 UK 10.2 0.5
All shifts reported are in percentage points. For example, the EU saw its share of exports to G7 countries rise from 74.3% in 2018 to 75.4% in 2023, which equates to a 1.1 percentage point increase.
The UK saw the largest uptick in trading with other countries within the G7 (+10.2 percentage points), namely the EU, as the post-Brexit trade slump to the region recovered.
Meanwhile, the U.S.-China trade dispute caused China’s share of exports to the G7 to fall by 5.2 percentage points from 2018 to 2023, the largest decline in our sample set. In fact, partly as a result of the conflict, the U.S. has by far the highest number of harmful tariffs in place.
The Russia-Ukraine War and ensuing sanctions by the West contributed to Russia’s share of exports to the G7 falling by 3.8 percentage points over the same timeframe.
India, South Africa, and the UK bucked the trend and continued to witness advances in exports with the opposing bloc.
Average Trade Shifts of G7 and BRICS Blocs
Though results varied significantly on a country-by-country basis, the broader trend towards favoring geopolitical allies in international trade is clear.
Bloc Change in Exports Within Bloc (pp) Change in Exports With Other Bloc (pp)
Average 2.1 -1.1
BRICS 1.6 -1.4
G7 incl. EU 2.4 -1.0
Overall, BRICS countries saw a larger shift away from exports with the other bloc, while for G7 countries the shift within their own bloc was more pronounced. This implies that though BRICS countries are trading less with the G7, they are relying more on trade partners outside their bloc to make up for the lost G7 share.
A Global Shift in International Trade and Geopolitical Proximity
The movement towards strengthening trade relations based on geopolitical proximity is a global trend.
The United Nations categorizes countries along a scale of geopolitical proximity based on UN voting records.
According to the organization’s analysis, international trade between geopolitically close countries rose from the first quarter of 2022 (when Russia first invaded Ukraine) to the third quarter of 2023 by over 6%. Conversely, trade with geopolitically distant countries declined.
The second piece in this series will explore China’s gradual move away from using the U.S. dollar in trade settlements.
Visit the Hinrich Foundation to learn more about the future of geopolitical trade

-

 Economy2 days ago
Economic Growth Forecasts for G7 and BRICS Countries in 2024
The IMF has released its economic growth forecasts for 2024. How do the G7 and BRICS countries compare?
-

 United States2 weeks ago
Ranked: The Largest U.S. Corporations by Number of Employees
We visualized the top U.S. companies by employees, revealing the massive scale of retailers like Walmart, Target, and Home Depot.
-

 Economy2 weeks ago
Where U.S. Inflation Hit the Hardest in March 2024
We visualized product categories that saw the highest % increase in price due to U.S. inflation as of March 2024.
-

 Economy1 month ago
G20 Inflation Rates: Feb 2024 vs COVID Peak
We visualize inflation rates across G20 countries as of Feb 2024, in the context of their COVID-19 pandemic peak.
-

 Economy1 month ago
Mapped: Unemployment Claims by State
This visual heatmap of unemployment claims by state highlights New York, California, and Alaska leading the country by a wide margin.
-

 Economy2 months ago
Confidence in the Global Economy, by Country
Will the global economy be stronger in 2024 than in 2023?


-

 Debt1 week ago
How Debt-to-GDP Ratios Have Changed Since 2000
-

 Markets2 weeks ago
Ranked: The World’s Top Flight Routes, by Revenue
-

 Demographics2 weeks ago
Population Projections: The World’s 6 Largest Countries in 2075
-

 Markets2 weeks ago
The Top 10 States by Real GDP Growth in 2023
-

 Demographics2 weeks ago
The Smallest Gender Wage Gaps in OECD Countries
-
Economy2 weeks ago
Where U.S. Inflation Hit the Hardest in March 2024
-

 Green2 weeks ago
Top Countries By Forest Growth Since 2001
-
United States2 weeks ago
Ranked: The Largest U.S. Corporations by Number of Employees