Misc
Median Age of the Population in Every Country
View the full-size version of the infographic
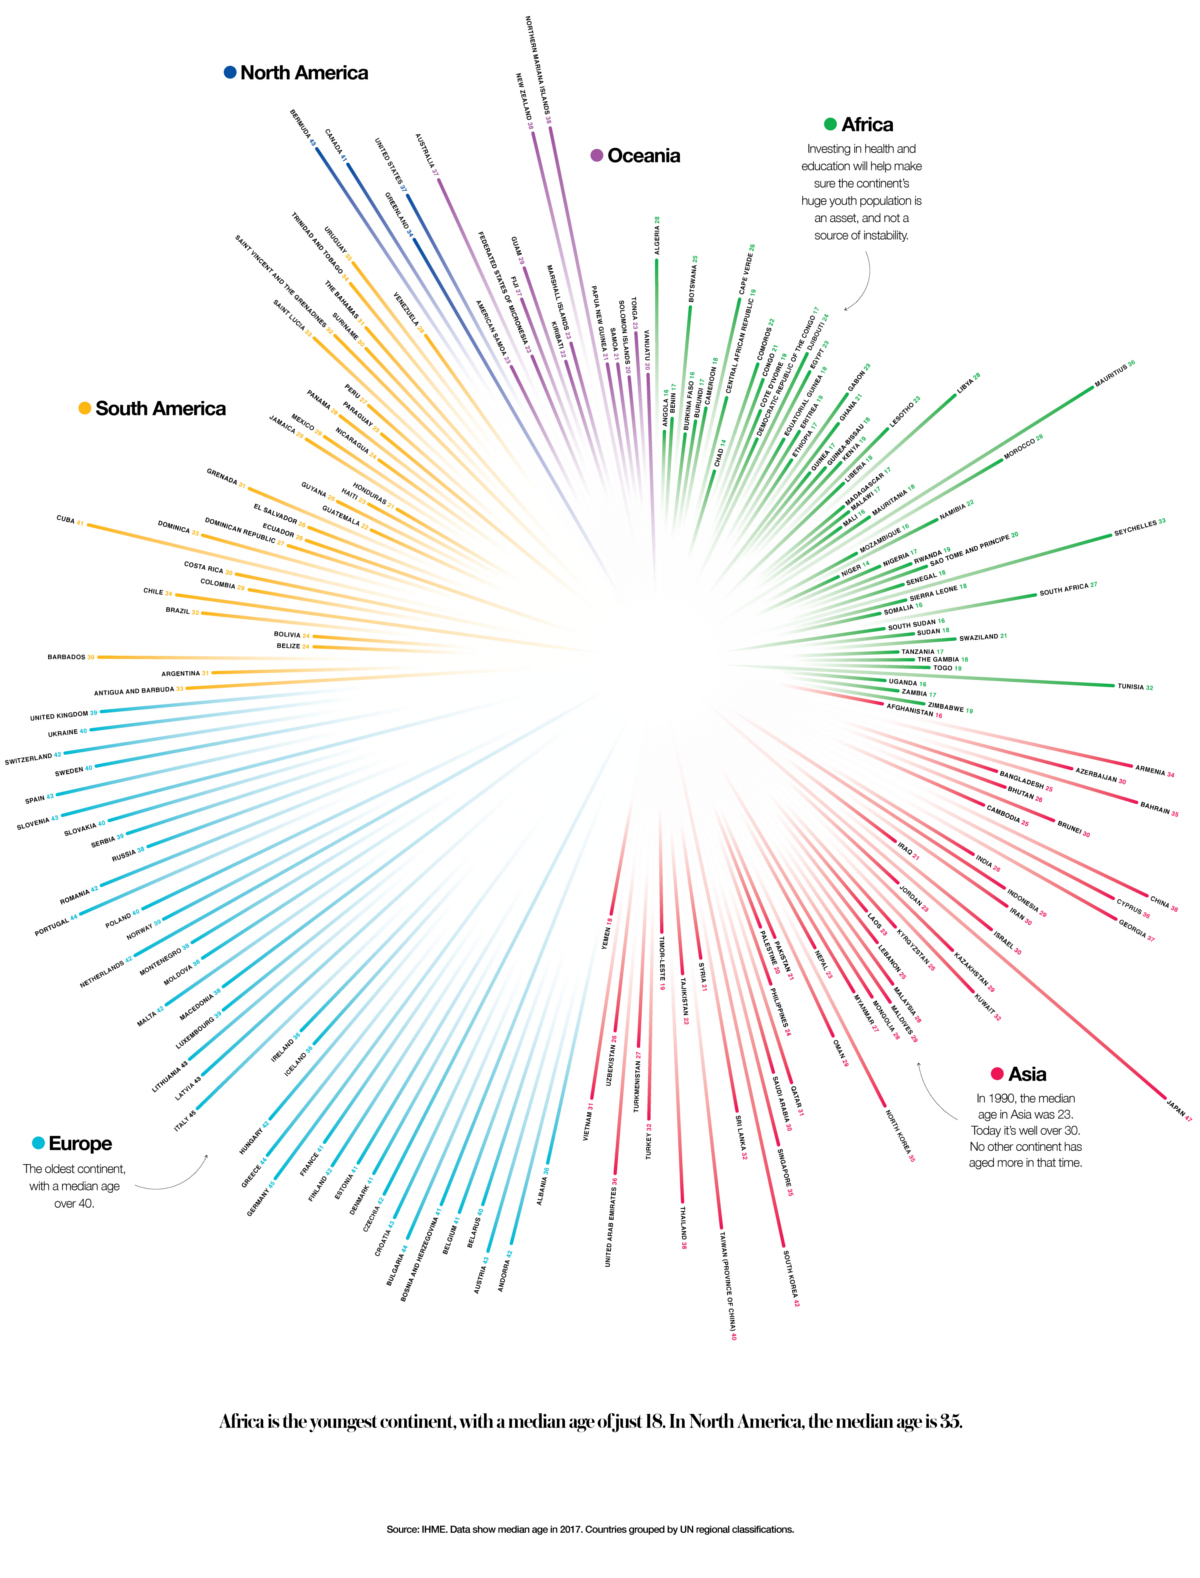
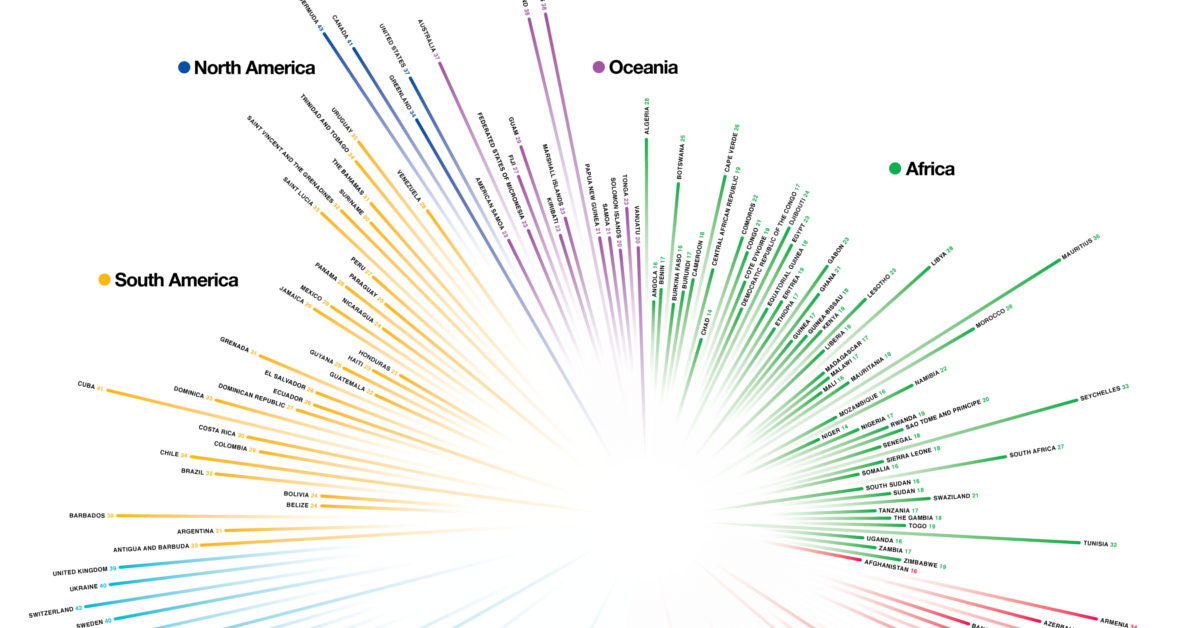
The Median Age of the Population in Every Country
View the full-size version of the infographic by clicking here
With a few notable exceptions, the world is rapidly aging.
Today’s infographic, which was shared by Bill Gates on Reddit, shows this incredible explosion in age and how different countries contrast with one another on this demographic metric.
While aging populations in Europe, North America, and Asia stand out on this type of visualization, it’s also important to look at the negative space. In both South America and Africa, populations are still quite young, with Africa getting younger and younger.
Note: The infographic is grouped based on U.N. regional classifications, and lumps Central America, the Caribbean, and South America as one demographic region.
The Oldest Countries
Which countries are the outliers in terms of global demographics?
Let’s start by taking a look at the oldest countries in terms of median age.
| Rank | Country | Median Age | Region |
|---|---|---|---|
| #1 | Japan | 47 years | Asia |
| #2 (t) | Germany | 45 years | Europe |
| #2 (t) | Italy | 45 years | Europe |
| #4 (t) | Greece | 44 years | Europe |
| #4 (t) | Bulgaria | 44 years | Europe |
| #4 (t) | Portugal | 44 years | Europe |
Japan takes the cake for the oldest population and it’s joined by a host of European nations.
The following countries tied for the #7 spot, which is just off of the above list: Austria, Croatia, Latvia, Lithuania, Slovenia, Spain, and Bermuda. All of these places had median ages of 43 years, with Bermuda being the only non-European state of this group.
It’s worth noting that some smaller countries appear to be excluded from Gates’ infographic. As we showed on our last chart covering the subject of median age, which uses a different data set, the small city-state of Monaco (which has a population of just 39,000 people) actually has the highest median age in the world at 53.1 years.
The Youngest Countries
Now, let’s take a peek at the world’s youngest countries in terms of median age.
| Rank | Country | Median Age | Region |
|---|---|---|---|
| #1 (t) | Chad | 14 years | Africa |
| #1 (t) | Niger | 14 years | Africa |
| #3 (t) | Afghanistan | 16 years | Middle East |
| #3 (t) | Angola | 16 years | Africa |
| #3 (t) | Burkina Faso | 16 years | Africa |
| #3 (t) | Mali | 16 years | Africa |
| #3 (t) | Somalia | 16 years | Africa |
| #3 (t) | South Sudan | 16 years | Africa |
| #3 (t) | Uganda | 16 years | Africa |
The youngest countries globally are Chad and Niger with a median population age of 14 years. Both are located in Sub-Saharan Africa.
The only non-African country is war-torn Afghanistan, where the median age is 16 years.
A variety of countries tied with a median age of 17 years old, which puts them just off of the above list. Those countries include: Benin, Burundi, Ethiopia, Madagascar, Malawi, Nigeria, Tanzania, Zambia, Yemen, and Timor-Leste.
More Context on Aging
Want to get an even better idea of what the world looks like as it ages?
To get a sense of change over the coming decades, it’s worth taking a look at this animation that shows median age projections with a focus on Western countries all the way until the year 2060.


VC+
VC+: Get Our Key Takeaways From the IMF’s World Economic Outlook
A sneak preview of the exclusive VC+ Special Dispatch—your shortcut to understanding IMF’s World Economic Outlook report.

Have you read IMF’s latest World Economic Outlook yet? At a daunting 202 pages, we don’t blame you if it’s still on your to-do list.
But don’t worry, you don’t need to read the whole April release, because we’ve already done the hard work for you.
To save you time and effort, the Visual Capitalist team has compiled a visual analysis of everything you need to know from the report—and our VC+ Special Dispatch is available exclusively to VC+ members. All you need to do is log into the VC+ Archive.
If you’re not already subscribed to VC+, make sure you sign up now to access the full analysis of the IMF report, and more (we release similar deep dives every week).
For now, here’s what VC+ members get to see.
Your Shortcut to Understanding IMF’s World Economic Outlook
With long and short-term growth prospects declining for many countries around the world, this Special Dispatch offers a visual analysis of the key figures and takeaways from the IMF’s report including:
- The global decline in economic growth forecasts
- Real GDP growth and inflation forecasts for major nations in 2024
- When interest rate cuts will happen and interest rate forecasts
- How debt-to-GDP ratios have changed since 2000
- And much more!

Get the Full Breakdown in the Next VC+ Special Dispatch
VC+ members can access the full Special Dispatch by logging into the VC+ Archive, where you can also check out previous releases.
Make sure you join VC+ now to see exclusive charts and the full analysis of key takeaways from IMF’s World Economic Outlook.
Don’t miss out. Become a VC+ member today.
What You Get When You Become a VC+ Member
VC+ is Visual Capitalist’s premium subscription. As a member, you’ll get the following:
- Special Dispatches: Deep dive visual briefings on crucial reports and global trends
- Markets This Month: A snappy summary of the state of the markets and what to look out for
- The Trendline: Weekly curation of the best visualizations from across the globe
- Global Forecast Series: Our flagship annual report that covers everything you need to know related to the economy, markets, geopolitics, and the latest tech trends
- VC+ Archive: Hundreds of previously released VC+ briefings and reports that you’ve been missing out on, all in one dedicated hub
You can get all of the above, and more, by joining VC+ today.

-

 Debt1 week ago
How Debt-to-GDP Ratios Have Changed Since 2000
-

 Markets2 weeks ago
Ranked: The World’s Top Flight Routes, by Revenue
-

 Demographics2 weeks ago
Population Projections: The World’s 6 Largest Countries in 2075
-

 Markets2 weeks ago
The Top 10 States by Real GDP Growth in 2023
-

 Demographics2 weeks ago
The Smallest Gender Wage Gaps in OECD Countries
-

 Economy2 weeks ago
Where U.S. Inflation Hit the Hardest in March 2024
-

 Green2 weeks ago
Top Countries By Forest Growth Since 2001
-

 United States2 weeks ago
Ranked: The Largest U.S. Corporations by Number of Employees