Demographics
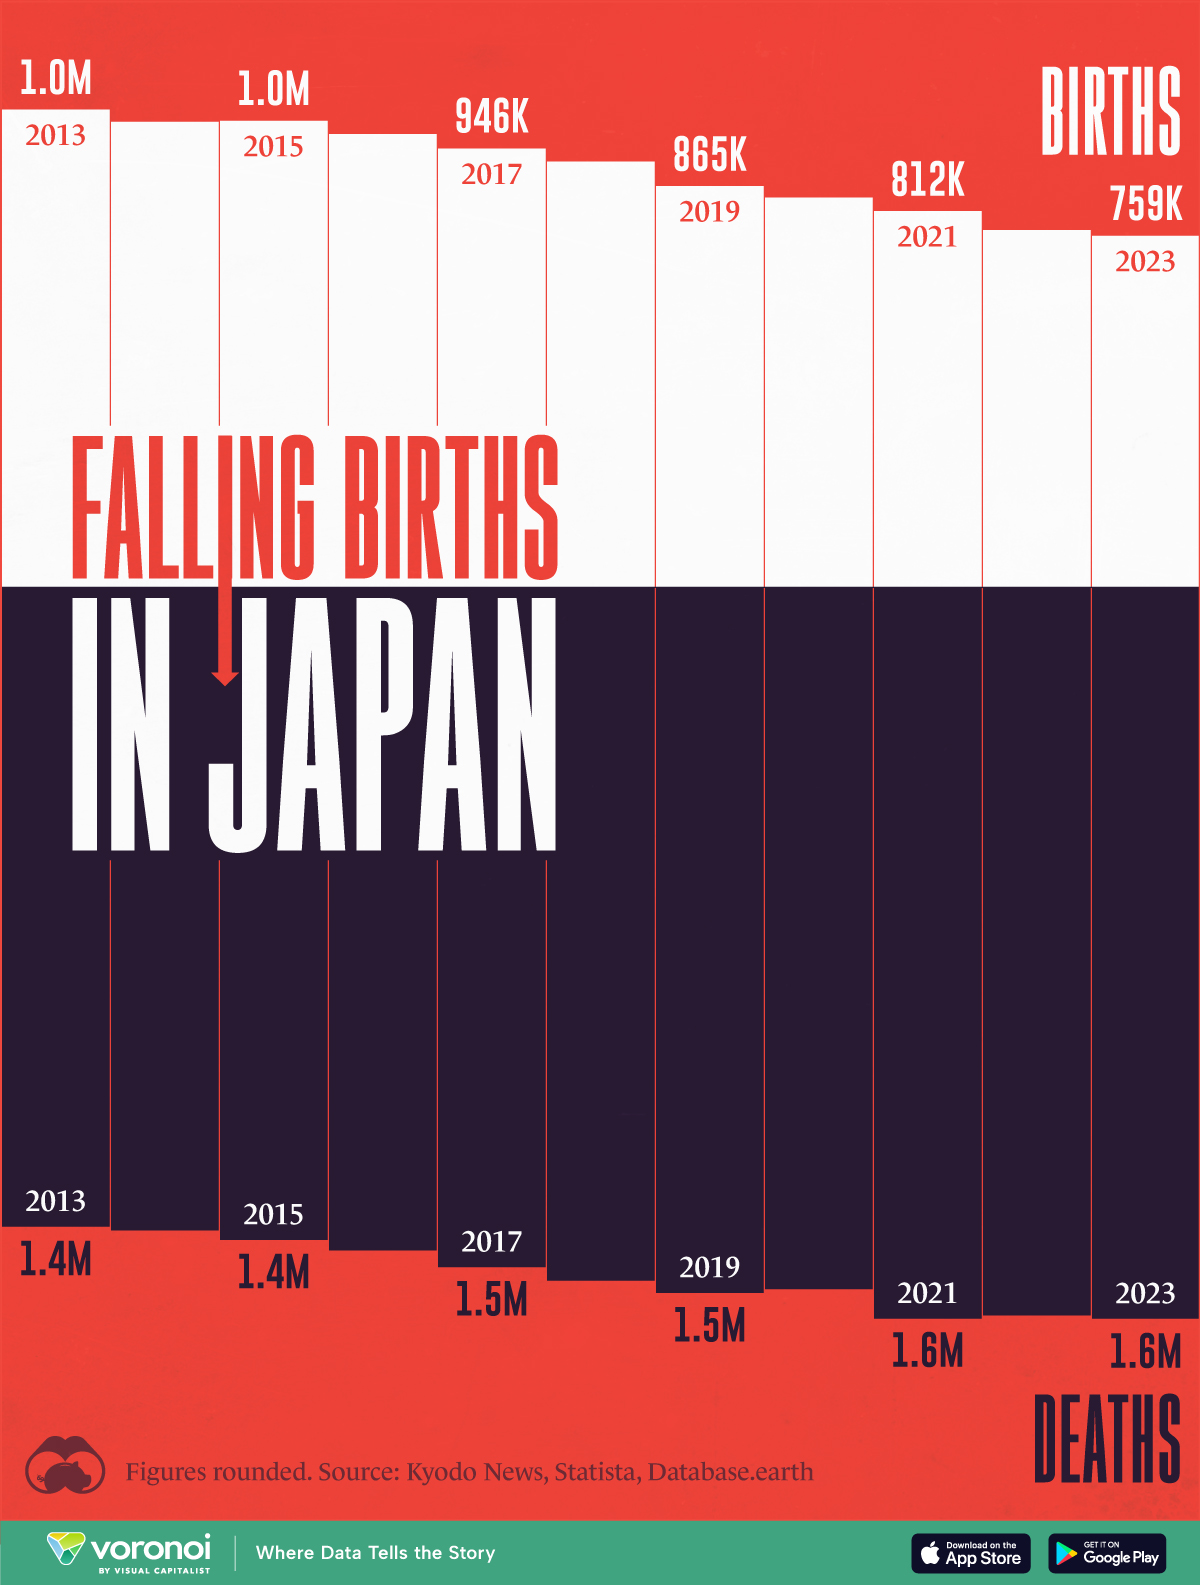
Visualizing the Declining Birth Rate in Japan
![]() See this visualization first on the Voronoi app.
See this visualization first on the Voronoi app.
Visualizing the Declining Birth Rate in Japan
This was originally posted on our Voronoi app. Download the app for free on iOS or Android and discover incredible data-driven charts from a variety of trusted sources.
Japan’s birth rate has been declining over the last three decades. While Japan’s population was 123.3 million in 2023, it is expected to decrease by approximately 29.4% to 87.0 million by 2070.
In this graphic, we use data from Kyodo News, Statista, and Database.earth to illustrate the number of live births each year in Japan, compared to the number of annual deaths. Figures were rounded.
Population Shrunk by Largest Margin Ever in 2023
Declining births and increasing deaths resulted in Japan’s total population falling by 831,872 people in 2023.
| Year | Births | Deaths |
|---|---|---|
| 2013 | 1,029,817 | 1,376,554 |
| 2014 | 1,003,609 | 1,384,931 |
| 2015 | 1,005,721 | 1,405,072 |
| 2016 | 977,242 | 1,428,060 |
| 2017 | 946,146 | 1,463,873 |
| 2018 | 918,400 | 1,493,140 |
| 2019 | 865,239 | 1,519,227 |
| 2020 | 840,835 | 1,511,209 |
| 2021 | 811,622 | 1,574,533 |
| 2022 | 770,759 | 1,567,933 |
| 2023 | 758,631 | 1,574,865 |
The National Institute of Population and Social Security Research once estimated that births would decline to below 760,000 in 2035.
With births in 2023 recorded at 758,631, this forecast was off by over 10 years.
Meanwhile, the number of deaths has increased over the last 10 years, surpassing 1.5 million in 2023, equivalent to 1.22% of the population.
Many younger Japanese hesitate to marry or start families due to bleak job prospects, corporate cultures unsupportive of working parents—especially women—and a lack of public tolerance for small children, as reported by the Associated Press. Rising costs also contribute to couples’ reluctance to have children.
The average number of children a woman gives birth to in her lifetime in Japan hit 1.26 in 2022. The fertility rate is far below the replacement rate of 2.1 considered necessary to maintain a population without immigration.
One of the biggest concerns is that a shrinking and aging population can have significant implications for the economy and national security.
As a result, Japan’s government is taking steps to cope with the declining birthrate, such as expanding childcare and promoting wage hikes for younger workers.


Demographics
The Countries That Have Become Sadder Since 2010
Tracking Gallup survey data for more than a decade reveals some countries are witnessing big happiness declines, reflecting their shifting socio-economic conditions.


The Countries That Have Become Sadder Since 2010
This was originally posted on our Voronoi app. Download the app for free on iOS or Android and discover incredible data-driven charts from a variety of trusted sources.
Can happiness be quantified?
Some approaches that try to answer this question make a distinction between two differing components of happiness: a daily experience part, and a more general life evaluation (which includes how people think about their life as a whole).
The World Happiness Report—first launched in 2012—has been making a serious go at quantifying happiness, by examining Gallup poll data that asks respondents in nearly every country to evaluate their life on a 0–10 scale. From this they extrapolate a single “happiness score” out of 10 to compare how happy (or unhappy) countries are.
More than a decade later, the 2024 World Happiness Report continues the mission. Its latest findings also include how some countries have become sadder in the intervening years.
Which Countries Have Become Unhappier Since 2010?
Afghanistan is the unhappiest country in the world right now, and is also 60% unhappier than over a decade ago, indicating how much life has worsened since 2010.
In 2021, the Taliban officially returned to power in Afghanistan, after nearly two decades of American occupation in the country. The Islamic fundamentalist group has made life harder, especially for women, who are restricted from pursuing higher education, travel, and work.
On a broader scale, the Afghan economy has suffered post-Taliban takeover, with various consequent effects: mass unemployment, a drop in income, malnutrition, and a crumbling healthcare system.
| Rank | Country | Happiness Score Loss (2010–24) | 2024 Happiness Score (out of 10) |
|---|---|---|---|
| 1 | 🇦🇫 Afghanistan | -2.6 | 1.7 |
| 2 | 🇱🇧 Lebanon | -2.3 | 2.7 |
| 3 | 🇯🇴 Jordan | -1.5 | 4.2 |
| 4 | 🇻🇪 Venezuela | -1.3 | 5.6 |
| 5 | 🇲🇼 Malawi | -1.2 | 3.4 |
| 6 | 🇿🇲 Zambia | -1.2 | 3.5 |
| 7 | 🇧🇼 Botswana | -1.2 | 3.4 |
| 8 | 🇾🇪 Yemen | -1.0 | 3.6 |
| 9 | 🇪🇬 Egypt | -1.0 | 4.0 |
| 10 | 🇮🇳 India | -0.9 | 4.1 |
| 11 | 🇧🇩 Bangladesh | -0.9 | 3.9 |
| 12 | 🇨🇩 DRC | -0.7 | 3.3 |
| 13 | 🇹🇳 Tunisia | -0.7 | 4.4 |
| 14 | 🇨🇦 Canada | -0.6 | 6.9 |
| 15 | 🇺🇸 U.S. | -0.6 | 6.7 |
| 16 | 🇨🇴 Colombia | -0.5 | 5.7 |
| 17 | 🇵🇦 Panama | -0.5 | 6.4 |
| 18 | 🇵🇰 Pakistan | -0.5 | 4.7 |
| 19 | 🇿🇼 Zimbabwe | -0.5 | 3.3 |
| 20 | 🇮🇪 Ireland | -0.5 | 6.8 |
| N/A | 🌍 World | +0.1 | 5.5 |
Nine countries in total saw their happiness score drop by a full point or more, on the 0–10 scale.
Noticeably, many of them have seen years of social and economic upheaval. Lebanon, for example, has been grappling with decades of corruption, and a severe liquidity crisis since 2019 that has resulted in a banking system collapse, sending poverty levels skyrocketing.
In Jordan, unprecedented population growth—from refugees leaving Iraq and Syria—has aggravated unemployment rates. A somewhat abrupt change in the line of succession has also raised concerns about political stability in the country.

-

 Debt1 week ago
How Debt-to-GDP Ratios Have Changed Since 2000
-

 Markets2 weeks ago
Ranked: The World’s Top Flight Routes, by Revenue
-

 Demographics2 weeks ago
Population Projections: The World’s 6 Largest Countries in 2075
-

 Markets2 weeks ago
The Top 10 States by Real GDP Growth in 2023
-

 Demographics2 weeks ago
The Smallest Gender Wage Gaps in OECD Countries
-

 Economy2 weeks ago
Where U.S. Inflation Hit the Hardest in March 2024
-

 Green2 weeks ago
Top Countries By Forest Growth Since 2001
-

 United States2 weeks ago
Ranked: The Largest U.S. Corporations by Number of Employees