Technology
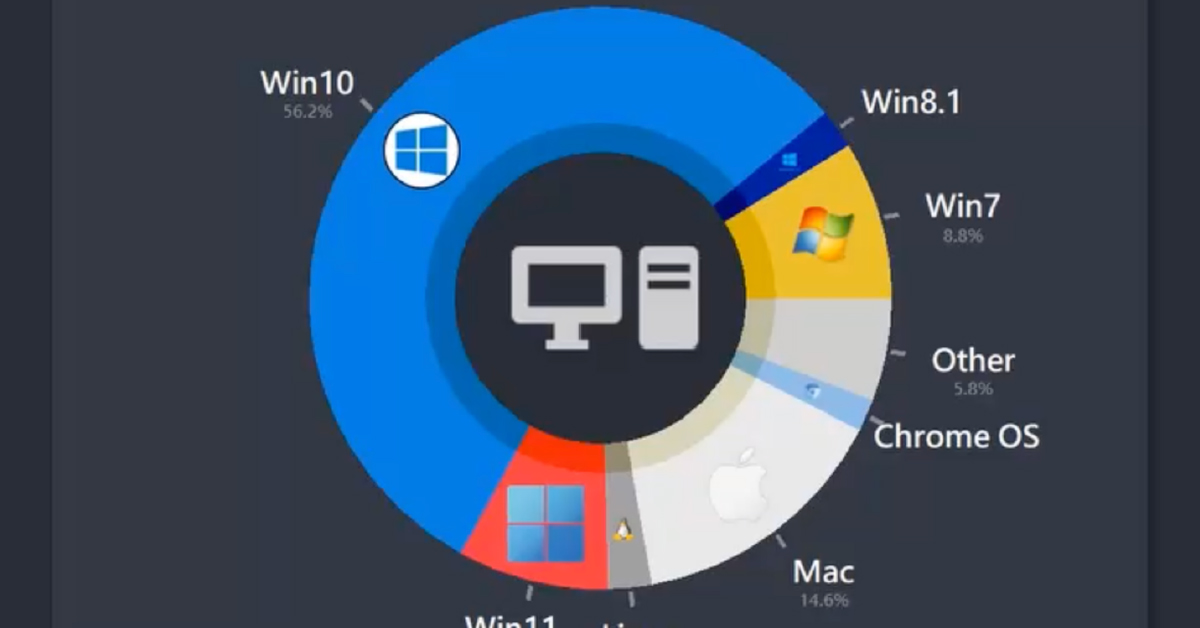
Animated: Most Popular Desktop Operating Systems Since 2003
Article/Editing:
The Most Popular Desktop Operating Systems Since 2003
Mobile phones might be the most common way of getting online today, but the digital and internet era started for most people with the humble desktop computer.
And over the past 20 years, a long list of operating systems (OS) have been used to run the most popular desktop computers.
Sjoerd Tilmans has created an animated chart showing the rise and fall in market share of popular desktop operating systems over the period of May 2003 to June 2022, using data from W3Schools and GS Stat Counter.
Microsoft’s Monopoly on the Most Popular Desktop OS
The story of the desktop OS market is a story of Microsoft’s explosive growth and market dominance.
In the 1980s, the fledgling company signed a partnership with personal computer behemoth IBM. Microsoft would supply IBM with an operating system for its computers, MS-DOS, and receive a royalty for every computer sold.
Those royalties boosted Microsoft’s coffers. And its release of Windows—a more visual interface than DOS—helped them grab hold of the PC market. The late 1990s and early 2000s saw different versions of Windows capture the market:
- Windows 95:
The now famous toolbar and Start menu made their debut here. The version also would launch Internet Explorer, once the world’s most popular browser. - Windows 98:
An upgrade to ‘95 which supported more hardware like USBs and connecting more than one monitor.
- Windows XP:
XP quickly became a fan-favorite because of its stability, and a hit with both commercial and personal computer clients. Windows XP gained market share steadily upon release in 2001, quickly becoming the most popular desktop OS with a peak of 76% market share in 2007.
| Operating System | Peak Market Share | Year |
|---|---|---|
| Win 95 | 57.4% | 1998 |
| Win 98 | 17.2% | 1999 |
| Win XP | 76.1% | 2006 |
Microsoft doubled down on their next releases from the end of the 2000s to 2020, with some misses (Windows Vista) and some hits (Windows 10). Here’s a look at the most popular ones:
- Windows 7:
Released as the successor to the poorly received Windows Vista, it kept the same visual style (“Aero”) but greatly improved performance and stability from Vista’s benchmarks. In 2011, Windows 7 passed XP to become the most popular desktop OS. - Windows 8 and 8.1:
Created for tablet-desktop integration, just as Microsoft released the companion Surface tablet. The beloved Start menu was replaced (an unpopular decision) and tile-based visual style introduced. However the dramatic differences between the desktop and tablet versions made for a steep learning curve, with the 8.1 release reintroducing the Start button. - Windows 10:
The follow-up to Windows 8 kept the the tile-based appearance but focused on a desktop-oriented interface with quality of life updates. By 2018, Windows 10 had become the most popular desktop OS, eventually peaking at 61% market share at the start of 2022.
| Date | Peak Market Share | Year |
|---|---|---|
| Win 7 | 55.1% | 2014 |
| Win 8 | 8.1% | 2013 |
| Win 8.1 | 16.8% | 2015 |
| Win 10 | 61.2% | 2022 |
The most recent version of Windows released, Windows 11, had updated graphics styling, widget integration, and introduced Microsoft’s latest internet browser Microsoft Edge. But it received a mixed response and slow uptake compared to Windows 10, gaining a market share of 8.3% by June 2022.
Microsoft Vs. Other Desktop OS Contenders
As of February 2023, Microsoft had a comfortable lead in the desktop OS market, holding nearly 72% of the market.
| Company | OS Name | Feb, 2023 Market Share |
|---|---|---|
| Microsoft | Windows | 72.0% |
| Apple | macOS | 16.3% |
| OpenSource | Linux | 2.9% |
| ChromeOS | 2.9% | |
| Unknown | Unknown | 6.0% |
In a distant second is Apple’s macOS. The most profitable company in the world might make most of their money from smartphones, but Apple has still managed to carve out a small but sturdy segment of the desktop operating OS market. It reached its peak of 19% in April 2020.
The other tech giant in the desktop OS game is Alphabet, whose ChromeOS is unique for using an internet browser (Google Chrome browser) as its primary interface. Generally packaged as a simpler and cheaper device option—it was primarily released with inexpensive laptops called “Chromebooks”. More recently, Alphabet announced a version that can be installed on existing computer hardware in 2022.
Compared to the commercially released OS above, Linux is completely free to download and use, and is the largest open-source software project in the world. Although the OS is only used in about 3% of desktop computers, it was also the basis of Android and ChromeOS, and is the most-used OS on devices with embedded software—routers, smart home devices, cars, and even a few spacecraft (The SpaceX Falcon 9, for example).

This article was published as a part of Visual Capitalist's Creator Program, which features data-driven visuals from some of our favorite Creators around the world.


Technology
All of the Grants Given by the U.S. CHIPS Act
Intel, TSMC, and more have received billions in subsidies from the U.S. CHIPS Act in 2024.


All of the Grants Given by the U.S. CHIPS Act
This was originally posted on our Voronoi app. Download the app for free on iOS or Android and discover incredible data-driven charts from a variety of trusted sources.
This visualization shows which companies are receiving grants from the U.S. CHIPS Act, as of April 25, 2024. The CHIPS Act is a federal statute signed into law by President Joe Biden that authorizes $280 billion in new funding to boost domestic research and manufacturing of semiconductors.
The grant amounts visualized in this graphic are intended to accelerate the production of semiconductor fabrication plants (fabs) across the United States.
Data and Company Highlights
The figures we used to create this graphic were collected from a variety of public news sources. The Semiconductor Industry Association (SIA) also maintains a tracker for CHIPS Act recipients, though at the time of writing it does not have the latest details for Micron.
| Company | Federal Grant Amount | Anticipated Investment From Company |
|---|---|---|
| 🇺🇸 Intel | $8,500,000,000 | $100,000,000,000 |
| 🇹🇼 TSMC | $6,600,000,000 | $65,000,000,000 |
| 🇰🇷 Samsung | $6,400,000,000 | $45,000,000,000 |
| 🇺🇸 Micron | $6,100,000,000 | $50,000,000,000 |
| 🇺🇸 GlobalFoundries | $1,500,000,000 | $12,000,000,000 |
| 🇺🇸 Microchip | $162,000,000 | N/A |
| 🇬🇧 BAE Systems | $35,000,000 | N/A |
BAE Systems was not included in the graphic due to size limitations
Intel’s Massive Plans
Intel is receiving the largest share of the pie, with $8.5 billion in grants (plus an additional $11 billion in government loans). This grant accounts for 22% of the CHIPS Act’s total subsidies for chip production.
From Intel’s side, the company is expected to invest $100 billion to construct new fabs in Arizona and Ohio, while modernizing and/or expanding existing fabs in Oregon and New Mexico. Intel could also claim another $25 billion in credits through the U.S. Treasury Department’s Investment Tax Credit.
TSMC Expands its U.S. Presence
TSMC, the world’s largest semiconductor foundry company, is receiving a hefty $6.6 billion to construct a new chip plant with three fabs in Arizona. The Taiwanese chipmaker is expected to invest $65 billion into the project.
The plant’s first fab will be up and running in the first half of 2025, leveraging 4 nm (nanometer) technology. According to TrendForce, the other fabs will produce chips on more advanced 3 nm and 2 nm processes.
The Latest Grant Goes to Micron
Micron, the only U.S.-based manufacturer of memory chips, is set to receive $6.1 billion in grants to support its plans of investing $50 billion through 2030. This investment will be used to construct new fabs in Idaho and New York.

-

 Debt1 week ago
How Debt-to-GDP Ratios Have Changed Since 2000
-

 Markets2 weeks ago
Ranked: The World’s Top Flight Routes, by Revenue
-

 Countries2 weeks ago
Population Projections: The World’s 6 Largest Countries in 2075
-

 Markets2 weeks ago
The Top 10 States by Real GDP Growth in 2023
-

 Demographics2 weeks ago
The Smallest Gender Wage Gaps in OECD Countries
-

 United States2 weeks ago
Where U.S. Inflation Hit the Hardest in March 2024
-

 Green2 weeks ago
Top Countries By Forest Growth Since 2001
-

 United States2 weeks ago
Ranked: The Largest U.S. Corporations by Number of Employees