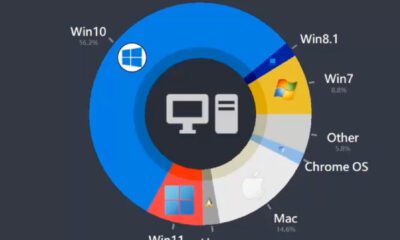

This animated chart that tracks market share of the most popular desktop operating systems between 2003 and 2022.
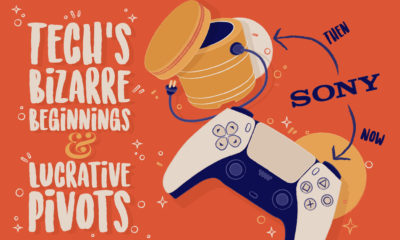

By embracing uncertainty and making timely pivots, we visualize the bizarre origin stories of the most successful tech companies today.


 Creator Program