Technology
Animation: The Rise and Fall of Popular Web Browsers Since 1994
Article/Editing:
Animation: The Rise and Fall of Popular Web Browsers Since 1994
In its early stages, the internet was a highly technical interface that most people had difficulty navigating. But that all changed when the Mosaic web browser entered the scene in 1993.
Mosaic was one of the first “user-friendly” internet portals—although by today’s standards, the browser was actually quite difficult to access. Comparatively, modern browsers in high use today have changed exponentially.
This animated graphic by James Eagle chronicles the evolution of the web browser market, showing the rise and fall of various internet portals from January 1994 to March 2022.
The 1990s: From Mosaic to Netscape
In the early 90s, Mosaic was by far the most dominant web browser. At the time, about 97% of all internet searches were done through this popular web portal.
| Web browser | % Share (January 1994) |
|---|---|
| Mosaic | 97.0% |
| Other | 3.0% |
Mosaic was the first web browser to display images directly on a page in line with text. Earlier browsers loaded pictures as separate files, which meant users have to click, download, and open a new file in order to view them.
The pioneering portal was created by a team of university undergrads at the University of Illinois, led by 21-year-old Marc Andreessen. When Andreessen graduated, he went on to be the co-founder of Mosaic Communications Corporation, which evolved into Netscape Communications Corporation, the company that created Netscape Navigator.
Netscape was essentially a new and improved version of Mosaic, but since the University of Illinois owned the rights to Mosaic, Andreessen’s new company couldn’t actually use any of the original code.
Netscape became a nearly instant success, and as a result, Mosaic’s market share began to fall. By the late 90s, Netscape had captured 89% of the web browser market.
| Web browser | % Share (April 1996) |
|---|---|
| Netscape | 88.9% |
| Mosaic | 7.2% |
| Internet Explorer | 3.9% |
Netscape dominated the market for a few more years. However, in the new millennium, a new tech giant started to take over—Internet Explorer.
The 2000s: Internet Explorer Enters the Chat, Followed by Firefox
In 1995, Microsoft launched Internet Explorer as part of an add-on package for its operating system, Microsoft Windows 95.
Given the popularity of the Windows franchise at the time, Internet Explorer was quickly adopted. By the early 2000s, it had captured over 90% of the market, reflecting Microsoft’s hold on the personal computing market.
| Web browser | % Share (January 2000) |
|---|---|
| Internet Explorer | 76.6% |
| Netscape | 18.4% |
| Opera | 0.7% |
| Other | 4.3% |
Netscape was mostly phased out of the market by then, which meant Internet Explorer didn’t have much competition until Mozilla entered the arena.
Founded by members of Netscape, Mozilla began in 1998 as a project for fostering innovation in the web browser market. They shared Netscape’s source code with the public, and over time built a community of programmers around the world that helped make the product even better.
By 2004, Mozilla launched Firefox, and by 2006, the free, open-source browser had captured nearly 30% of the market. Firefox and Internet Explorer battled it out for a few more years, but by the mid-2010s, both browsers started to get leapfrogged by Google Chrome.
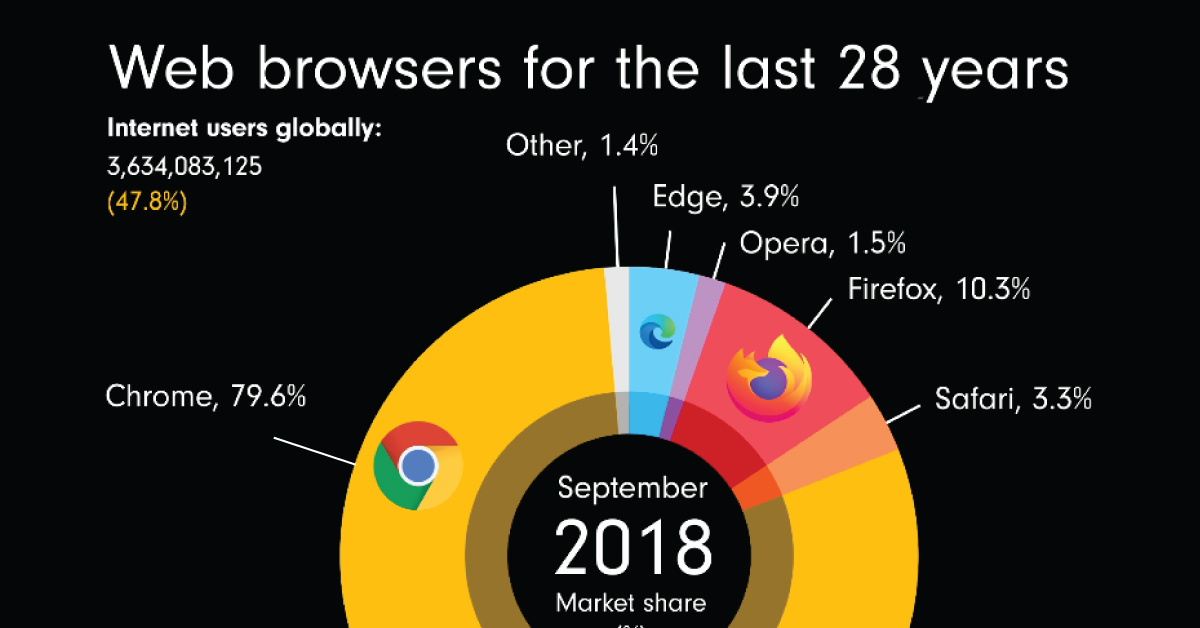
Present Day: Google Chrome is King of the Web Browsers
When Google’s co-founders Larry Page and Sergey Brin pitched the idea of starting a Google web browser to CEO Larry Schmidt in 2003, he was worried that they couldn’t keep up with the fierce competition. Eventually, the co-founders convinced Schmidt, and in 2008, Google Chrome was released to the public.
One of Chrome’s distinguishing features was (and still is) the fact that each tab operated separately. This meant that if one tab froze, it wouldn’t stall or crash the others, at the cost of higher memory and CPU usage.
By 2013, Chrome had swallowed up half the market. And with Android emerging as the most popular mobile OS on the global market, there were even more Chrome installations (and of course, searches on Google) as a result.
Notes on Data and Methodology
It’s important to note that the dataset in this animation uses visitor log files from web development site and resource W3Schools from 1999 onwards. Despite getting more than 60 million monthly visits, its userbase is likely slanted towards PC over mobile users.
Further, though Google’s Android platform has a sizable lead over Apple’s iOS in the global mobile sector, this likely slant also impacts the representation of iOS and therefore Safari browsers in the animation and dataset.

This article was published as a part of Visual Capitalist's Creator Program, which features data-driven visuals from some of our favorite Creators around the world.


Technology
Countries With the Highest Rates of Crypto Ownership
While the U.S. is a major market for cryptocurrencies, two countries surpass it in terms of their rates of crypto ownership.


Countries With the Highest Rates of Crypto Ownership
This was originally posted on our Voronoi app. Download the app for free on iOS or Android and discover incredible data-driven charts from a variety of trusted sources.
This graphic ranks the top 10 countries by their rate of cryptocurrency ownership, which is the percentage of the population that owns crypto. These figures come from crypto payment gateway, Triple-A, and are as of 2023.
Data and Highlights
The table below lists the rates of crypto ownership in the top 10 countries, as well as the number of people this amounts to.
| Country | % of Population Who Own Crypto | # of Crypto Owners |
|---|---|---|
| 🇦🇪 United Arab Emirates | 30.4 | 3M |
| 🇻🇳 Vietnam | 21.2 | 21M |
| 🇺🇸 U.S. | 15.6 | 53M |
| 🇮🇷 Iran | 13.5 | 12M |
| 🇵🇭 Philippines | 13.4 | 16M |
| 🇧🇷 Brazil | 12 | 26M |
| 🇸🇦 Saudi Arabia | 11.4 | 4M |
| 🇸🇬 Singapore | 11.1 | 665K |
| 🇺🇦 Ukraine | 10.6 | 4M |
| 🇻🇪 Venezuela | 10.3 | 3M |
Note that if we were to rank countries based on their actual number of crypto owners, India would rank first at 93 million people, China would rank second at 59 million people, and the U.S. would rank third at 52 million people.
The UAE Takes the Top Spot
The United Arab Emirates (UAE) boasts the highest rates of crypto ownership globally. The country’s government is considered to be very crypto friendly, as described in Henley & Partners’ Crypto Wealth Report 2023:
In the UAE, the Financial Services Regulatory Authority (FSRA-ADGM) was the first to provide rules and regulations regarding cryptocurrency purchasing and selling. The Emirates are generally very open to new technologies and have proposed zero taxes for crypto owners and businesses.
Vietnam leads Southeast Asia
According to the Crypto Council for Innovation, cryptocurrency holdings in Vietnam are also untaxed, making them an attractive asset.
Another reason for Vietnam’s high rates of ownership could be its large unbanked population (people without access to financial services). Cryptocurrencies may provide an alternative means of accessing these services without relying on traditional banks.
Learn More About Crypto From Visual Capitalist
If you enjoyed this post, be sure to check out The World’s Largest Corporate Holders of Bitcoin, which ranks the top 12 publicly traded companies by their Bitcoin holdings.

-

 Markets5 days ago
Mapped: The Most Valuable Company in Each Southeast Asian Country
-

 Markets2 weeks ago
The Top Private Equity Firms by Country
-

 Jobs2 weeks ago
The Best U.S. Companies to Work for According to LinkedIn
-

 Economy2 weeks ago
Ranked: The Top 20 Countries in Debt to China
-

 Politics1 week ago
Charted: Trust in Government Institutions by G7 Countries
-

 Energy1 week ago
Mapped: The Age of Energy Projects in Interconnection Queues, by State
-

 Mining1 week ago
Visualizing Global Gold Production in 2023
-

 Markets1 week ago
Visualized: Interest Rate Forecasts for Advanced Economies