Technology
Animation: How the Mobile Phone Market Has Evolved Over 30 Years
Article/Editing:
How The Mobile Phone Market Has Evolved Since 1993
The mobile phone landscape looks drastically different today than it did three decades ago.
In 1993, Motorola accounted for more than half of the mobile phone market. But by 2021, its market share had shrunk to just 2.2%. How did this happen, and how has the mobile industry changed over the last 30 years?
This video by James Eagle chronicles the evolution of the mobile phone market, showing the rise and fall of various mobile phone manufacturers. The data spans from December 1992 to December 2021.
The Early Days of Mobile Phones
Motorola is known for being a pioneer in the mobile phone industry.
In 1983, the American company launched one of the world’s first commercially available mobile phones—the DynaTAC 8000X. The revolutionary analog phone cost nearly $4,000 and offered users up to 30 minutes of talk time before needing to be recharged.
Motorola went on to launch a few more devices over the next few years, like the MicroTAC 9800X in 1989 and the International 3200 in 1992, and quickly became a dominant player in the nascent industry. In the early days of the market, the company’s only serious competitor was Finnish multinational Nokia, which had acquired the early mobile network pioneer Mobira.
But by the mid-1990s, other competitors like Sony and Siemens started to gain some solid footing, which chipped away at Motorola’s dominance. In September 1995, the company’s market share was down to 32.1%.
| Mobile Phone Market Share by Company | % Share (Sept. 1995) |
|---|---|
| Motorola | 32.1% |
| Nokia | 22.0% |
| Sony | 10.7% |
| NEC | 9.2% |
| Siemens | 2.1% |
| Samsung | 0.4% |
| Other | 23.5% |
By January 1999, Nokia surpassed Motorola as the leading mobile phone manufacturer, accounting for 21.4% of global market share. That put it just slightly ahead of Motorola’s 20.8%.
One of the reasons for Nokia’s surging popularity was the major headway the company was making in the digital phone space. In 1999, the company released the Nokia 7110, the first mobile phone to have a web browser.
But it wasn’t just Nokia’s innovations that were hampering Motorola. In 1999, Motorola fell on hard times after one of its spin-off projects called Iridium SSC filed for bankruptcy. This put a massive financial strain on the company, and it eventually laid off a large chunk of its workforce after the project failed.
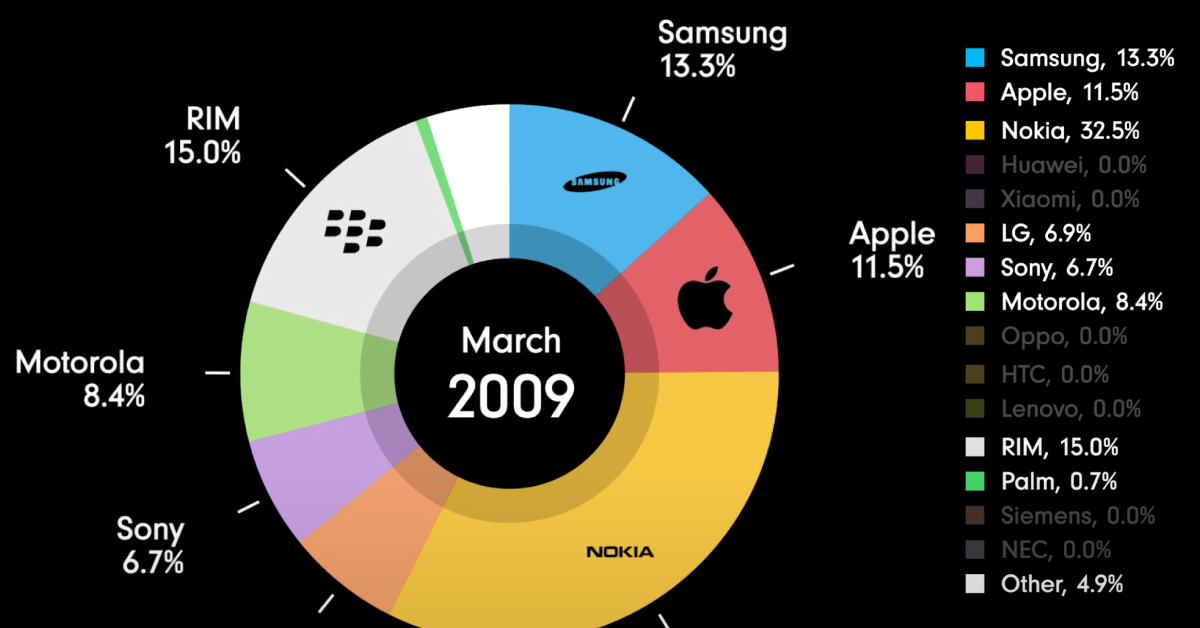
From then on, Motorola’s market share hovered between 14% and 20%, until Apple’s iPhone entered the scene in 2007 and turned the mobile phone industry on its head.
The Emergence of the iPhone
Things really started to change with the launch of the iPhone in 2007.
In a keynote presentation at the San Francisco Macworld Expo in 2007, Steve Jobs presented the iPhone as three products wrapped into one device: a touchscreen iPod, a revolutionary cell phone, and an internet communications device.
One year later, Apple launched the App Store, which gave users the ability to download applications and games onto their iPhones. Not only did this greatly enhance the iPhone’s functionality, but it also allowed consumers to customize their mobile devices like never before.
This was the start of a new era of smartphones—one that Motorola failed to keep up with. Less than two years after the iPhone launched, Apple had captured 17.4% of the mobile phone market. In contrast, Motorola’s market share had shrunk down to 4.9%.
By the end of 2021, Apple held about 27.3% of the global mobile market. The iPhone is a key part of the tech giant’s growth, driving more than 50% of the company’s overall revenue.
A Failure to Pivot
While a number of factors contributed to Motorola’s downfall, many point to one central hurdle—the company’s failure to pivot.
The iPhone’s emergence was the start of a new, software-driven era. Motorola had mastered the hardware-driven era, but failed to keep up when the tides changed. And the animation above highlights other companies that also failed to adapt or keep up, including BlackBerry (formerly RIM), Palm, Sony, and LG.
But Apple is not alone. The popularity of Google’s Android mobile operating system has helped competitors like South Korea’s Samsung and China’s Huawei and Xiaomi flourish, with each company establishing strong footholds in the global mobile phone market.
In today’s fast-paced world, the ability to pivot is essential if businesses want to remain competitive. Will today’s mobile phone giants like Apple and Samsung remain on top? Or will other companies like Huawei catch up in the next few years?

This article was published as a part of Visual Capitalist's Creator Program, which features data-driven visuals from some of our favorite Creators around the world.


Technology
All of the Grants Given by the U.S. CHIPS Act
Intel, TSMC, and more have received billions in subsidies from the U.S. CHIPS Act in 2024.


All of the Grants Given by the U.S. CHIPS Act
This was originally posted on our Voronoi app. Download the app for free on iOS or Android and discover incredible data-driven charts from a variety of trusted sources.
This visualization shows which companies are receiving grants from the U.S. CHIPS Act, as of April 25, 2024. The CHIPS Act is a federal statute signed into law by President Joe Biden that authorizes $280 billion in new funding to boost domestic research and manufacturing of semiconductors.
The grant amounts visualized in this graphic are intended to accelerate the production of semiconductor fabrication plants (fabs) across the United States.
Data and Company Highlights
The figures we used to create this graphic were collected from a variety of public news sources. The Semiconductor Industry Association (SIA) also maintains a tracker for CHIPS Act recipients, though at the time of writing it does not have the latest details for Micron.
| Company | Federal Grant Amount | Anticipated Investment From Company |
|---|---|---|
| 🇺🇸 Intel | $8,500,000,000 | $100,000,000,000 |
| 🇹🇼 TSMC | $6,600,000,000 | $65,000,000,000 |
| 🇰🇷 Samsung | $6,400,000,000 | $45,000,000,000 |
| 🇺🇸 Micron | $6,100,000,000 | $50,000,000,000 |
| 🇺🇸 GlobalFoundries | $1,500,000,000 | $12,000,000,000 |
| 🇺🇸 Microchip | $162,000,000 | N/A |
| 🇬🇧 BAE Systems | $35,000,000 | N/A |
BAE Systems was not included in the graphic due to size limitations
Intel’s Massive Plans
Intel is receiving the largest share of the pie, with $8.5 billion in grants (plus an additional $11 billion in government loans). This grant accounts for 22% of the CHIPS Act’s total subsidies for chip production.
From Intel’s side, the company is expected to invest $100 billion to construct new fabs in Arizona and Ohio, while modernizing and/or expanding existing fabs in Oregon and New Mexico. Intel could also claim another $25 billion in credits through the U.S. Treasury Department’s Investment Tax Credit.
TSMC Expands its U.S. Presence
TSMC, the world’s largest semiconductor foundry company, is receiving a hefty $6.6 billion to construct a new chip plant with three fabs in Arizona. The Taiwanese chipmaker is expected to invest $65 billion into the project.
The plant’s first fab will be up and running in the first half of 2025, leveraging 4 nm (nanometer) technology. According to TrendForce, the other fabs will produce chips on more advanced 3 nm and 2 nm processes.
The Latest Grant Goes to Micron
Micron, the only U.S.-based manufacturer of memory chips, is set to receive $6.1 billion in grants to support its plans of investing $50 billion through 2030. This investment will be used to construct new fabs in Idaho and New York.

-

 Debt1 week ago
How Debt-to-GDP Ratios Have Changed Since 2000
-

 Markets2 weeks ago
Ranked: The World’s Top Flight Routes, by Revenue
-

 Countries2 weeks ago
Population Projections: The World’s 6 Largest Countries in 2075
-

 Markets2 weeks ago
The Top 10 States by Real GDP Growth in 2023
-

 Demographics2 weeks ago
The Smallest Gender Wage Gaps in OECD Countries
-

 United States2 weeks ago
Where U.S. Inflation Hit the Hardest in March 2024
-

 Green2 weeks ago
Top Countries By Forest Growth Since 2001
-

 United States2 weeks ago
Ranked: The Largest U.S. Corporations by Number of Employees