Nvidia is coming for Intel’s crown. Samsung is losing ground. AI is transforming the space. We break down revenue for semiconductor companies.


This graphic breaks down America's most preferred smartphone brands, according to a December 2023 consumer survey.
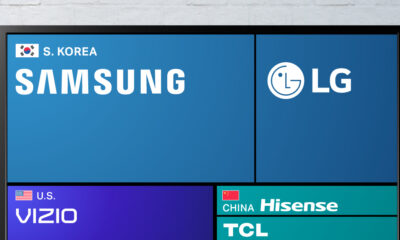

Korean brands dominate the U.S. TV market.


Advanced semiconductors drive technological innovation across various industries. Here, we visualize foundry capacity by country.
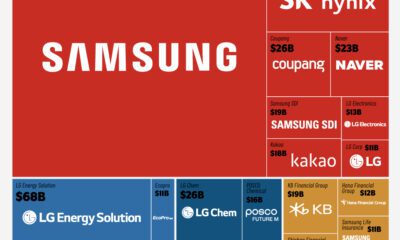

South Korea's most valuable companies are familiar names: large conglomerates with diverse holdings in different parts of the economy.
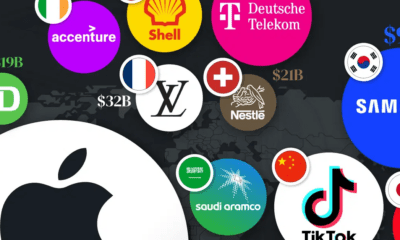

This graphic visualizes the most valuable brands by country in 12 major economies, from tech and energy giants to automakers and banks.
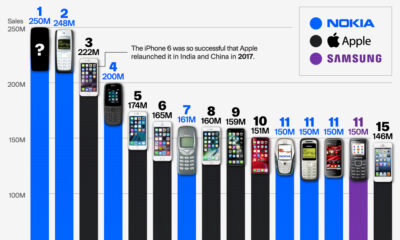

Samsungs, Motorolas, and iPhones, but which model tops the list of most sold mobile phones of all time?
Most of the 10 largest semiconductor foundries in the world, are headquartered in just three Asian countries, accounting for 90% of the entire industry's revenue.
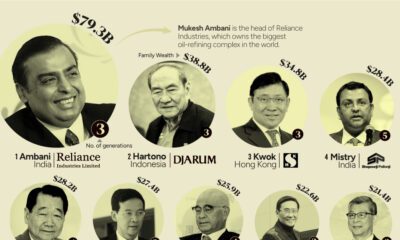

This graphic shows the 15 richest families in Asia. From energy to banking, these dynasties have built fortunes across many sectors.
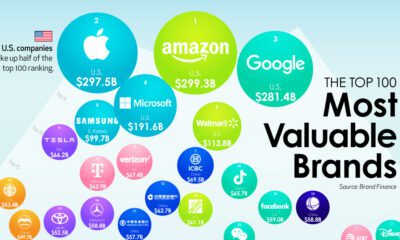

We show the top companies by brand value—and the brands that are rising the fastest as consumer expectations shift.