Healthcare
Ranked: The Most Prescribed Drugs in the U.S.
Every day, millions of people in the U.S. take prescribed drugs to help them live their lives.
As our understanding of medicine has evolved, weโve been able to develop drugs to aid with some of the most common medical conditionsโfrom pain and blood pressure drugs to asthma medication, thyroid treatments, and antidepressants.
This graphic uses prescribed medicines data from the U.S. Agency for Healthcare Research and Quality, released in 2021 for the 2019 calendar year. It also uses supporting drug and health information from MedlinePlus.
What are the Most Prescribed Drugs in America?
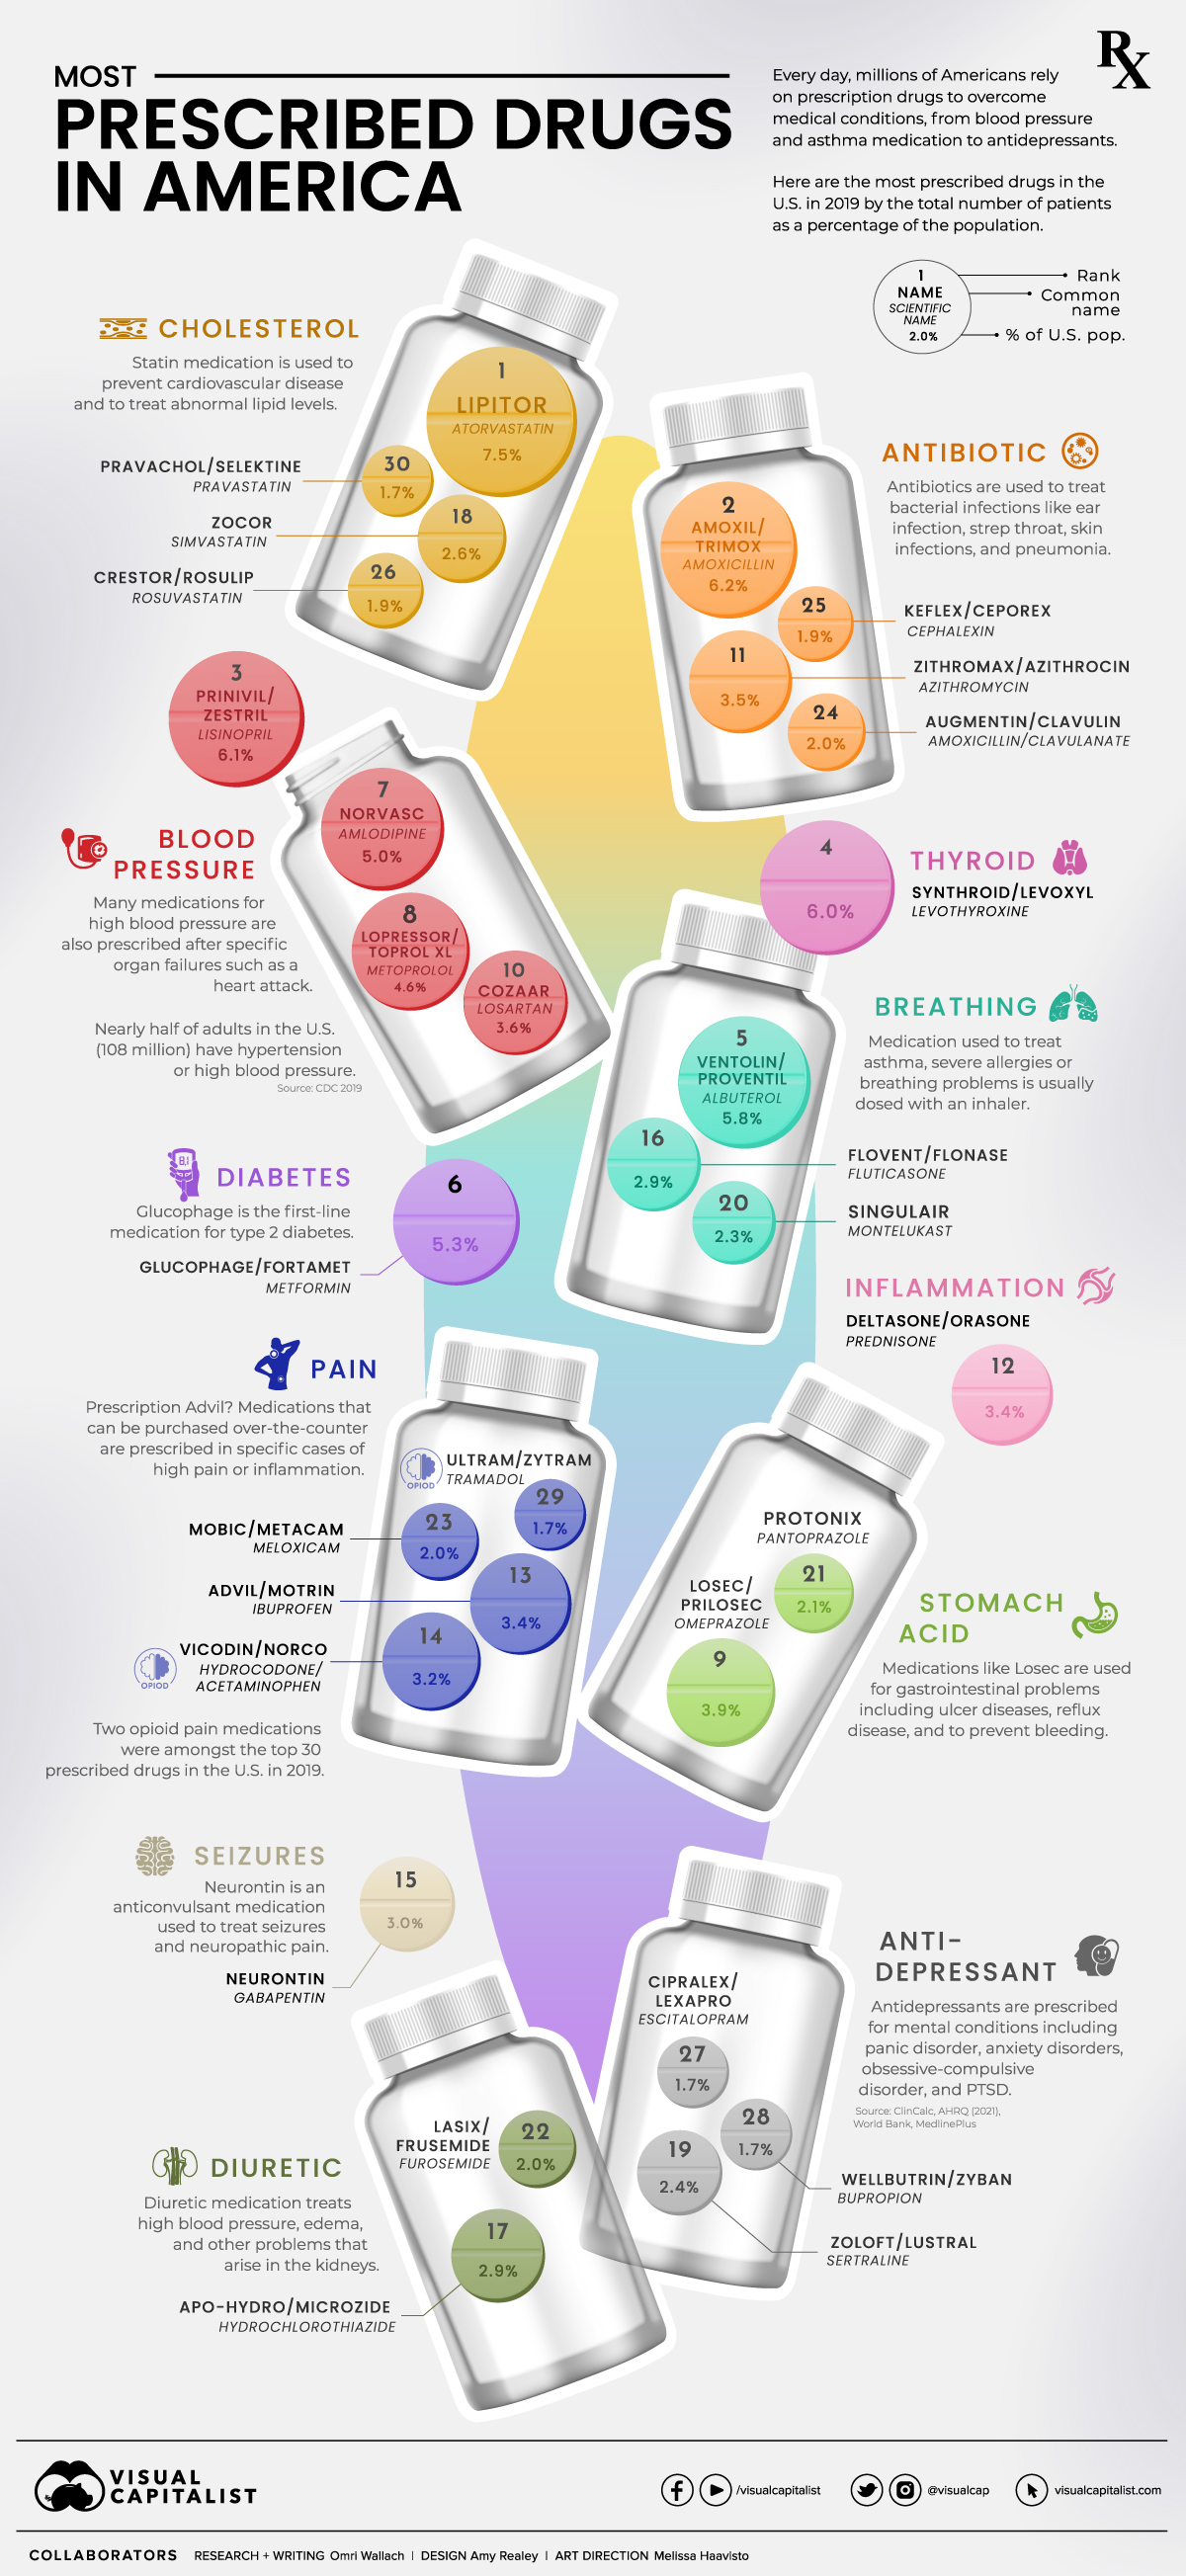
Sorting the annual prescribed medicines data by the total number of patients highlights how important and prevalent some drugs are in America.
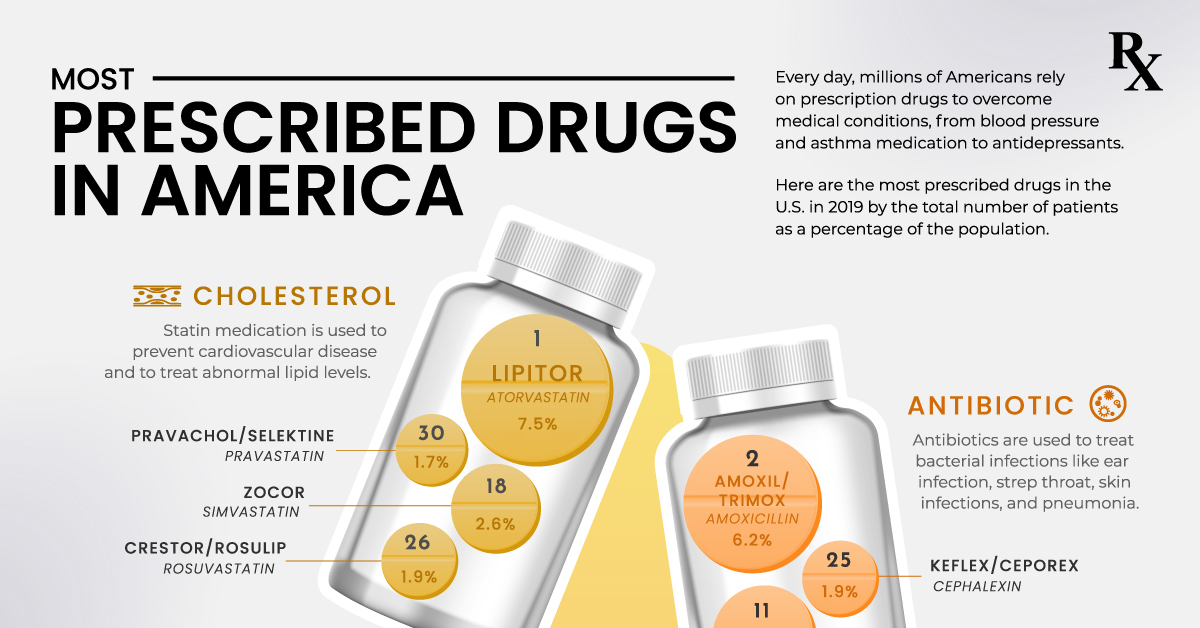
The most prescribed drug, atorvastatin (sold under brand Lipitor), was prescribed to 24.5 million people in the U.S. in 2019, or 7.5% of the population. It was one of many statin medications listed, which are used to prevent cardiovascular disease and treat abnormal lipid levels.
In fact, a majority of the most prescribed drugs in the U.S. are used to treat high blood pressure or symptoms of it. Thatโs because 108 million or nearly half of adults in the U.S. have hypertension or high blood pressure.
Drug Name | Total U.S. Patients (2019) | Brand Name | Primary Use |
---|---|---|---|
Atorvastatin | 24,493,971 | Lipitor | Cholesterol |
Amoxicillin | 20,368,921 | Amoxil, Trimox | Antibiotic |
Lisinopril | 19,990,170 | Prinivil, Zestril | Blood Pressure |
Levothyroxine | 19,698,087 | Synthroid, Levoxyl | Thyroid |
Albuterol | 19,085,418 | Ventolin, Proventil | Breathing |
Metformin | 17,430,765 | Glucophage, Fortamet | Diabetes |
Amlodipine | 16,419,181 | Norvasc | Blood Pressure |
Metoprolol | 15,177,787 | Lopressor, Toprol XL | Blood Pressure |
Omeprazole | 12,869,290 | Losec, Prilosec | Stomach Acid |
Losartan | 11,760,646 | Cozaar | Blood Pressure |
Azithromycin | 11,577,286 | Zithromax, Azithrocin | Antibiotic |
Prednisone | 10,999,246 | Deltasone, Orasone | Inflammation |
Ibuprofen | 10,951,995 | Advil, Motrin | Pain |
Hydrocodone/Acetaminophen | 10,409,764 | Vicodin/Norco | Pain (Opioid) |
Gabapentin | 9,818,634 | Neurontin | Seizures |
Fluticasone | 9,564,147 | Flovent, Flonase | Breathing |
Hydrochlorothiazide | 9,358,879 | Apo-Hydro, Microzide | Diuretic |
Simvastatin | 8,543,612 | Zocor | Cholesterol |
Sertraline | 7,723,122 | Zoloft, Lustral | Antidepressant |
Montelukast | 7,429,725 | Singulair | Breathing |
Pantoprazole | 6,777,996 | Protonix | Stomach Acid |
Furosemide | 6,640,042 | Lasix, Frusemide | Diuretic |
Meloxicam | 6,484,210 | Mobic, Metacam | Pain |
Amoxicillin; Clavulanate | 6,468,086 | Augmentin, Clavulin | Antibiotic |
Cephalexin | 6,267,878 | Keflex, Ceporex | Antibiotic |
Rosuvastatin | 6,129,254 | Crestor, Rosulip | Cholesterol |
Escitalopram | 5,544,406 | Cipralex, Lexapro | Antidepressant |
Bupropion | 5,520,278 | Wellbutrin, Zyban | Antidepressant |
Tramadol | 5,496,843 | Ultram, Zytram | Pain (Opioid) |
Pravastatin | 5,420,488 | Pravachol, Selektine | Cholesterol |
Other common prescriptions include antibiotics like amoxicillin and azithromycin, used to treat bacterial infections, as well as levothyroxine, which was used by 19.7 million Americans to treat thyroid hormone deficiency.
Asthma medication albuterol (usually prescribed through an inhaler) rounded out the top five prescribed drugs with the most patients, followed closely by Type 2 diabetes medication glucophage.
The Top Medical Conditions Treated by Prescription Drugs
The prevalence of cardiovascular-related medication becomes clear when combining the total patients for each type of medication.
The total number of patients with prescribed medication for blood pressure or cholesterol combined for 33% of the U.S. population.
Compared to that, medication for pain or inflammation were the most frequent on the top 30 list with five occurrences, but were only prescribed to 13.6% of people. That includes hydrocodone (known by the brand name Vicodin) and tramadol (known by the brand name Ultram), two opioid medications.
Primary Use of Prescribed Drug | U.S. Patients as % Pop (2019) |
---|---|
Blood Pressure | 19.4% |
Antibiotic | 13.7% |
Cholesterol | 13.6% |
Pain/Inflammation | 13.6% |
Breathing | 11.0% |
Thyroid | 6.0% |
Stomach Acid | 6.0% |
Antidepressant | 5.7% |
Diabetes | 5.3% |
Diuretic | 4.9% |
Seizures | 3.0% |
Most of the top 30 prescribed medications for specific conditions saw patients total less than 6% of the U.S. population. They include thyroid issues, gastrointestinal conditions, and mental conditions treated by antidepressants (including panic disorder, anxiety disorders, and PTSD).
But itโs important to remember that some patients have multiple prescriptions for serious conditions with multiple symptoms, or comorbid conditionsโwhen more than one disease or condition is present at the same time.
Drug Spending in the U.S.
A prescribed drugโs total number of patients doesnโt necessarily reflect how important it is, or how expensive it is for the end user.
Levothyroxine is the fourth-most prescribed drug by total patients, but the second-most prescribed drug by total prescriptions with 102.6 million in 2019 at an average cost of $25.10 per prescription.
More specialized medication like fluticasone had significantly less total prescriptions with 27.9 million, but an average cost of $97.68 per prescription.
Prices are influenced by a drugโs demand, whether or not itโs patented or available in generic form, and a countryโs healthcare system. As far as OECD countries go, the U.S. ranks as the most costly almost across the board.
Since the current rankings look at the U.S. pre-COVID, next year’s prescription data will be illuminating as to the state of American health (and healthcare).
Countries
Charted: The Worldโs Aging Population from 1950 to 2100
This graphic visualizes the worldโs aging population, showing data for every country and territory around the world.

Charted: The Worldโs Aging Population from 1950 to 2100
As demographics continue to shift in the 21st century, the worldโs aging population will continue to be a focal point for many global decision makers.
Most countries around the world have experienced population explosions, or are about to. Combine this with declining birth rates and falling mortality rates, and it’s clear that the global senior population will continue to reach new heights.
These graphics by Pablo Alvarez use data from the 2022 UN World Population Prospects to visualize this increasing aging population across countries.
The Worldโs Aging Population from 1950 to 2100
In 2022, there were 771 million people aged 65+ years globally, accounting for almost 10% of the world’s population.
This segment has been growing at an increasing rate, and it’s expected to hit 16% in 2050, and eventually 24% by 2100. Here’s what that’s projected to look like, for every country and territory.
Country by Population Aged +65 Years | 1950 | 2022 | 2100 |
---|---|---|---|
๐ฆ๐ซ Afghanistan | 2.85% | 2.39% | 16.03% |
๐ฆ๐ฑ Albania | 6.04% | 16.66% | 49.08% |
๐ฉ๐ฟ Algeria | 3.49% | 6.39% | 28.83% |
๐ฆ๐ธ American Samoa | 2.38% | 7.27% | 45.41% |
๐ฆ๐ฉ Andorra | 10.02% | 14.98% | 37.04% |
๐ฆ๐ด Angola | 2.93% | 2.6% | 12.07% |
๐ฆ๐ฎ Anguilla | 3.69% | 10.71% | 37.49% |
๐ฆ๐ฌ Antigua and Barbuda | 4.14% | 10.63% | 35.4% |
๐ฆ๐ท Argentina | 4.13% | 11.92% | 31.79% |
๐ฆ๐ฒ Armenia | 8.17% | 13.15% | 36.13% |
๐ฆ๐ผ Aruba | 1.77% | 16.15% | 36.51% |
๐ฆ๐บ Australia | 8.17% | 16.9% | 31.38% |
๐ฆ๐น Austria | 10.42% | 19.81% | 33.93% |
๐ฆ๐ฟ Azerbaijan | 6.89% | 7.11% | 30.5% |
๐ง๐ธ Bahamas | 4.76% | 8.89% | 29.58% |
๐ง๐ญ Bahrain | 2.88% | 3.76% | 21.89% |
๐ง๐ฉ Bangladesh | 3.9% | 6.04% | 32.56% |
๐ง๐ง Barbados | 5.24% | 16.28% | 33.19% |
๐ง๐พ Belarus | 8.24% | 17.18% | 30.45% |
๐ง๐ช Belgium | 11.03% | 19.73% | 32.83% |
๐ง๐ฟ Belize | 3.57% | 5.09% | 29.21% |
๐ง๐ฏ Benin | 7.85% | 3.06% | 11.03% |
๐ง๐ฒ Bermuda | 5.71% | 20.41% | 37.73% |
๐ง๐น Bhutan | 2.53% | 6.25% | 33.35% |
๐ง๐ด Bolivia | 6.11% | 4.85% | 21.75% |
๐ง๐ถ Bonaire Sint Eustatius and Saba | 14.22% | 13.84% | 28.94% |
๐ง๐ฆ Bosnia and Herzegovina | 3.95% | 18.4% | 36.4% |
๐ง๐ผ Botswana | 4.32% | 3.65% | 17.96% |
๐ง๐ท Brazil | 2.39% | 9.88% | 33.52% |
๐ป๐ฌ British Virgin Islands | 8.63% | 9.95% | 32.47% |
๐ง๐ณ Brunei | 4.85% | 6.17% | 30.93% |
๐ง๐ฌ Bulgaria | 6.66% | 22.38% | 37.13% |
๐ง๐ซ Burkina Faso | 2.01% | 2.53% | 13.07% |
๐ง๐ฎ Burundi | 3.22% | 2.48% | 13.23% |
๐ฐ๐ญ Cambodia | 2.67% | 5.81% | 26.43% |
๐จ๐ฒ Cameroon | 3.47% | 2.67% | 11.89% |
๐จ๐ฆ Canada | 7.7% | 19.03% | 31.55% |
๐จ๐ป Cape Verde | 3.67% | 5.55% | 32.63% |
๐ฐ๐พ Cayman Islands | 6.05% | 8.17% | 28.75% |
๐จ๐ซ Central African Republic | 5.% | 2.51% | 11.43% |
๐น๐ฉ Chad | 4.33% | 2.01% | 9.64% |
๐จ๐ฑ Chile | 3.3% | 13.03% | 36.61% |
๐จ๐ณ China | 5.04% | 13.72% | 40.93% |
๐จ๐ด Colombia | 3.22% | 9.% | 34.49% |
๐ฐ๐ฒ Comoros | 3.8% | 4.28% | 17.81% |
๐จ๐ฌ Congo | 3.36% | 2.72% | 11.99% |
๐จ๐ฐ Cook Islands | 2.94% | 11.73% | 29.75% |
๐จ๐ท Costa Rica | 2.97% | 10.83% | 36.99% |
๐จ๐ฎ Cote d'Ivoire | 2.21% | 2.4% | 10.86% |
๐ญ๐ท Croatia | 7.82% | 22.36% | 37.03% |
๐จ๐บ Cuba | 4.36% | 15.81% | 36.31% |
๐จ๐ผ Curacao | 5.82% | 14.95% | 30.46% |
๐จ๐พ Cyprus | 5.95% | 14.83% | 33.36% |
๐จ๐ฟ Czechia | 8.29% | 20.64% | 26.94% |
๐จ๐ฉ Democratic Republic of Congo | 3.77% | 2.92% | 10.62% |
๐ฉ๐ฐ Denmark | 9.04% | 20.49% | 30.45% |
๐ฉ๐ฏ Djibouti | 1.99% | 4.54% | 19.68% |
๐ฉ๐ฒ Dominica | 7.67% | 9.53% | 34.28% |
๐ฉ๐ด Dominican Republic | 2.72% | 7.4% | 30.47% |
๐ช๐จ Ecuador | 5.2% | 7.83% | 31.97% |
๐ช๐ฌ Egypt | 2.95% | 4.83% | 21.77% |
๐ธ๐ป El Salvador | 3.93% | 8.22% | 36.02% |
๐ฌ๐ถ Equatorial Guinea | 5.53% | 3.12% | 15.13% |
๐ช๐ท Eritrea | 3.2% | 4.01% | 19.86% |
๐ช๐ช Estonia | 10.56% | 20.58% | 34.15% |
๐ธ๐ฟ Eswatini | 2.68% | 4.% | 16.26% |
๐ช๐น Ethiopia | 3.01% | 3.14% | 18.6% |
๐ซ๐ด Faeroe Islands | 7.59% | 17.92% | 26.91% |
๐ซ๐ฐ Falkland Islands | 8.27% | 11.08% | 35.86% |
๐ซ๐ฏ Fiji | 5.99% | 5.9% | 20.6% |
๐ซ๐ฎ Finland | 6.63% | 23.27% | 34.04% |
๐ซ๐ท France | 11.39% | 21.66% | 34.23% |
๐ฌ๐ซ French Guiana | 7.96% | 5.98% | 21.13% |
๐ต๐ซ French Polynesia | 3.% | 10.07% | 37.85% |
๐ฌ๐ฆ Gabon | 7.21% | 3.89% | 16.25% |
๐ฌ๐ฒ Gambia | 2.5% | 2.43% | 16.06% |
๐ฌ๐ช Georgia | 9.35% | 14.61% | 31.19% |
๐ฉ๐ช Germany | 9.46% | 22.41% | 33.72% |
๐ฌ๐ญ Ghana | 4.62% | 3.55% | 15.91% |
๐ฌ๐ฎ Gibraltar | 6.94% | 20.84% | 37.63% |
๐ฌ๐ท Greece | 6.8% | 22.82% | 37.52% |
๐ฌ๐ฑ Greenland | 3.06% | 10.02% | 29.16% |
๐ฌ๐ฉ Grenada | 5.12% | 10.07% | 30.54% |
๐ฌ๐ต Guadeloupe | 5.51% | 20.04% | 34.45% |
๐ฌ๐บ Guam | 1.11% | 11.84% | 31.19% |
๐ฌ๐น Guatemala | 2.31% | 4.91% | 28.05% |
๐ฌ๐ฌ Guernsey | 11.96% | 16.64% | 35.4% |
๐ฌ๐ณ Guinea | 5.39% | 3.32% | 14.% |
๐ฌ๐ผ Guinea-Bissau | 3.45% | 2.82% | 14.34% |
๐ฌ๐พ Guyana | 3.89% | 6.28% | 28.94% |
๐ญ๐น Haiti | 3.64% | 4.54% | 19.07% |
๐ญ๐ณ Honduras | 3.96% | 4.27% | 26.5% |
๐ญ๐ฐ Hong Kong | 2.48% | 20.47% | 41.64% |
๐ญ๐บ Hungary | 7.81% | 20.01% | 31.85% |
๐ฎ๐ธ Iceland | 7.52% | 15.33% | 34.25% |
๐ฎ๐ณ India | 3.1% | 6.9% | 29.81% |
๐ฎ๐ฉ Indonesia | 1.74% | 6.86% | 25.28% |
๐ฎ๐ท Iran | 5.22% | 7.62% | 33.72% |
๐ฎ๐ถ Iraq | 2.79% | 3.41% | 18.44% |
๐ฎ๐ช Ireland | 10.99% | 15.14% | 32.48% |
๐ฎ๐ฒ Isle of Man | 13.9% | 22.29% | 31.8% |
๐ฎ๐ฑ Israel | 4.% | 12.04% | 25.97% |
๐ฎ๐น Italy | 8.09% | 24.05% | 38.19% |
๐ฏ๐ฒ Jamaica | 3.83% | 7.45% | 44.05% |
๐ฏ๐ต Japan | 4.89% | 29.92% | 38.7% |
๐ฏ๐ช Jersey | 12.34% | 16.22% | 30.52% |
๐ฏ๐ด Jordan | 5.03% | 3.84% | 27.3% |
๐ฐ๐ฟ Kazakhstan | 6.47% | 8.04% | 19.58% |
๐ฐ๐ช Kenya | 5.28% | 2.87% | 16.98% |
๐ฐ๐ฎ Kiribati | 7.13% | 3.81% | 17.33% |
๐ฝ๐ฐ Kosovo | 5.33% | 10.19% | 43.35% |
๐ฐ๐ผ Kuwait | 2.88% | 4.93% | 31.56% |
๐ฐ๐ฌ Kyrgyzstan | 7.91% | 4.54% | 21.08% |
๐ฑ๐ฆ Laos | 2.13% | 4.45% | 25.24% |
๐ฑ๐ป Latvia | 10.12% | 21.86% | 32.86% |
๐ฑ๐ง Lebanon | 7.24% | 9.89% | 32.11% |
๐ฑ๐ธ Lesotho | 6.34% | 4.2% | 13.44% |
๐ฑ๐ท Liberia | 2.97% | 3.31% | 13.88% |
๐ฑ๐พ Libya | 5.21% | 4.86% | 27.77% |
๐ฑ๐ฎ Liechtenstein | 7.89% | 19.37% | 34.79% |
๐ฑ๐น Lithuania | 8.65% | 20.8% | 32.79% |
๐ฑ๐บ Luxembourg | 9.71% | 15.03% | 31.55% |
๐ฒ๐ด Macao | 3.11% | 13.% | 32.39% |
๐ฒ๐ฌ Madagascar | 3.25% | 3.35% | 16.21% |
๐ฒ๐ผ Malawi | 3.06% | 2.61% | 15.61% |
๐ฒ๐พ Malaysia | 4.91% | 7.5% | 30.78% |
๐ฒ๐ป Maldives | 3.14% | 4.78% | 35.61% |
๐ฒ๐ฑ Mali | 2.78% | 2.38% | 11.% |
๐ฒ๐น Malta | 7.42% | 19.13% | 38.26% |
๐ฒ๐ญ Marshall Islands | 5.68% | 4.56% | 17.8% |
๐ฒ๐ถ Martinique | 5.85% | 22.77% | 37.31% |
๐ฒ๐ท Mauritania | 1.44% | 3.22% | 15.03% |
๐ฒ๐บ Mauritius | 3.18% | 12.79% | 33.76% |
๐พ๐น Mayotte | 6.61% | 2.88% | 18.15% |
๐ฒ๐ฝ Mexico | 2.99% | 8.32% | 34.88% |
๐ซ๐ฒ Micronesia (country) | 4.11% | 6.16% | 27.59% |
๐ฒ๐ฉ Moldova | 7.56% | 12.98% | 26.36% |
๐ฒ๐จ Monaco | 15.64% | 35.92% | 30.16% |
๐ฒ๐ณ Mongolia | 3.87% | 4.61% | 26.18% |
๐ฒ๐ช Montenegro | 7.85% | 16.55% | 34.16% |
๐ฒ๐ธ Montserrat | 7.92% | 17.7% | 33.05% |
๐ฒ๐ฆ Morocco | 2.86% | 7.72% | 29.97% |
๐ฒ๐ฟ Mozambique | 3.13% | 2.57% | 13.43% |
๐ฒ๐ฒ Myanmar | 3.21% | 6.82% | 23.69% |
๐ณ๐ฆ Namibia | 4.1% | 3.97% | 15.38% |
๐ณ๐ท Nauru | 8.98% | 2.5% | 15.87% |
๐ณ๐ต Nepal | 2.74% | 6.09% | 29.51% |
๐ณ๐ฑ Netherlands | 7.76% | 20.31% | 32.89% |
๐ณ๐จ New Caledonia | 5.% | 11.02% | 31.61% |
๐ณ๐ฟ New Zealand | 9.09% | 16.31% | 33.2% |
๐ณ๐ฎ Nicaragua | 2.71% | 5.29% | 28.92% |
๐ณ๐ช Niger | .92% | 2.4% | 9.76% |
๐ณ๐ฌ Nigeria | 3.% | 2.97% | 12.31% |
๐ณ๐บ Niue | 4.79% | 15.16% | 22.55% |
๐ฐ๐ต North Korea | 2.72% | 11.71% | 30.49% |
๐ฒ๐ฐ North Macedonia | 5.87% | 14.91% | 36.56% |
๐ฒ๐ต Northern Mariana Islands | 2.95% | 10.81% | 32.09% |
๐ณ๐ด Norway | 9.52% | 18.44% | 31.65% |
๐ด๐ฒ Oman | 3.05% | 2.76% | 23.96% |
๐ต๐ฐ Pakistan | 5.48% | 4.27% | 17.23% |
๐ต๐ผ Palau | 8.59% | 9.93% | 21.48% |
๐ต๐ธ Palestine | 4.77% | 3.53% | 23.44% |
๐ต๐ฆ Panama | 3.57% | 8.77% | 30.03% |
๐ต๐ฌ Papua New Guinea | 1.09% | 3.19% | 16.81% |
๐ต๐พ Paraguay | 3.73% | 6.26% | 26.51% |
๐ต๐ช Peru | 3.43% | 8.41% | 30.33% |
๐ต๐ญ Philippines | 3.56% | 5.44% | 23.38% |
๐ต๐ฑ Poland | 5.22% | 18.55% | 35.69% |
๐ต๐น Portugal | 7.% | 22.9% | 36.28% |
๐ต๐ท Puerto Rico | 3.63% | 22.93% | 48.9% |
๐ถ๐ฆ Qatar | 3.5% | 1.52% | 15.01% |
๐ท๐ช Reunion | 3.81% | 13.28% | 32.4% |
๐ท๐ด Romania | 7.16% | 18.64% | 32.22% |
๐ท๐บ Russia | 4.8% | 15.8% | 27.86% |
๐ท๐ผ Rwanda | 2.76% | 3.2% | 17.36% |
๐ง๐ฑ Saint Barthlemy | 7.3% | 10.61% | 43.89% |
๐ธ๐ญ Saint Helena | 8.63% | 28.66% | 32.61% |
๐ฐ๐ณ Saint Kitts and Nevis | 5.36% | 10.13% | 29.79% |
๐ฑ๐จ Saint Lucia | 3.59% | 9.23% | 33.39% |
๐ฒ๐ซ Saint Martin (French part) | 4.47% | 11.14% | 30.08% |
๐ต๐ฒ Saint Pierre and Miquelon | 6.34% | 17.32% | 33.4% |
๐ป๐จ Saint Vincent and the Grenadines | 7.71% | 10.86% | 32.34% |
๐ผ๐ธ Samoa | 2.52% | 5.22% | 18.75% |
๐ธ๐ฒ San Marino | 10.15% | 20.47% | 35.73% |
๐ธ๐น Sao Tome and Principe | 3.92% | 3.76% | 15.6% |
๐ธ๐ฆ Saudi Arabia | 3.32% | 2.81% | 30.28% |
๐ธ๐ณ Senegal | 3.42% | 3.14% | 16.54% |
๐ท๐ธ Serbia | 6.15% | 20.56% | 37.55% |
๐ธ๐จ Seychelles | 10.68% | 8.16% | 28.84% |
๐ธ๐ฑ Sierra Leone | 3.02% | 3.14% | 15.52% |
๐ธ๐ฌ Singapore | 2.29% | 15.12% | 36.51% |
๐ธ๐ฝ Sint Maarten (Dutch part) | 12.03% | 10.57% | 34.51% |
๐ธ๐ฐ Slovakia | 6.63% | 16.98% | 33.4% |
๐ธ๐ฎ Slovenia | 7.52% | 20.96% | 33.59% |
๐ธ๐ง Solomon Islands | 4.03% | 3.47% | 15.29% |
๐ธ๐ด Somalia | 2.6% | 2.57% | 10.75% |
๐ฟ๐ฆ South Africa | 4.06% | 5.89% | 20.55% |
๐ฐ๐ท South Korea | 2.74% | 17.49% | 44.44% |
๐ธ๐ธ South Sudan | 3.48% | 2.89% | 13.11% |
๐ช๐ธ Spain | 7.23% | 20.27% | 38.72% |
๐ฑ๐ฐ Sri Lanka | 8.76% | 11.54% | 35.73% |
๐ธ๐ฉ Sudan | 3.03% | 3.5% | 13.28% |
๐ธ๐ท Suriname | 4.09% | 7.39% | 25.8% |
๐ธ๐ช Sweden | 10.19% | 20.25% | 31.83% |
๐จ๐ญ Switzerland | 9.49% | 19.31% | 32.61% |
๐ธ๐พ Syria | 7.66% | 4.68% | 24.62% |
๐น๐ผ Taiwan | 2.11% | 16.71% | 37.32% |
๐น๐ฏ Tajikistan | 4.34% | 3.47% | 19.43% |
๐น๐ฟ Tanzania | 2.2% | 3.1% | 14.97% |
๐น๐ญ Thailand | 3.21% | 15.21% | 39.17% |
๐น๐ฑ Timor | 3.14% | 5.21% | 25.42% |
๐น๐ฌ Togo | 4.29% | 3.13% | 11.77% |
๐น๐ฐ Tokelau | 4.7% | 8.66% | 25.03% |
๐น๐ด Tonga | 4.6% | 6.22% | 21.65% |
๐น๐น Trinidad and Tobago | 3.93% | 11.52% | 32.67% |
๐น๐ณ Tunisia | 4.4% | 9.02% | 31.24% |
๐น๐ท Turkey | 3.77% | 8.64% | 33.9% |
๐น๐ฒ Turkmenistan | 5.84% | 5.15% | 21.55% |
๐น๐จ Turks and Caicos Islands | 5.79% | 10.34% | 28.25% |
๐น๐ป Tuvalu | 4.98% | 6.48% | 16.15% |
๐บ๐ฌ Uganda | 2.87% | 1.69% | 14.33% |
๐บ๐ฆ Ukraine | 7.54% | 18.81% | 33.2% |
๐ฆ๐ช United Arab Emirates | 3.35% | 1.83% | 15.77% |
๐ฌ๐ง United Kingdom | 10.84% | 19.17% | 32.56% |
๐บ๐ธ United States | 8.18% | 17.13% | 30.47% |
๐ป๐ฎ United States Virgin Islands | 7.54% | 20.42% | 39.11% |
๐บ๐พ Uruguay | 8.23% | 15.58% | 35.98% |
๐บ๐ฟ Uzbekistan | 5.87% | 5.14% | 22.24% |
๐ป๐บ Vanuatu | 5.65% | 3.74% | 16.29% |
๐ป๐ช Venezuela | 2.29% | 8.61% | 27.71% |
๐ป๐ณ Vietnam | 4.13% | 9.12% | 30.02% |
๐ผ๐ซ Wallis and Futuna | 1.76% | 13.47% | 32.98% |
๐ช๐ญ Western Sahara | 2.82% | 5.84% | 23.73% |
๐พ๐ช Yemen | 3.98% | 2.66% | 18.25% |
๐ฟ๐ฒ Zambia | 2.76% | 1.75% | 12.66% |
๐ฟ๐ผ Zimbabwe | 3.18% | 3.32% | 14.22% |
๐ World | 5.13% | 9.82% | 24.03% |
Some of the places with high elderly shares today include high-income countries like Japan (30%), Italy (24%), and Finland (23%).
The lowest shares are concentrated in the Middle East and Africa. Many countries have just 2% of their population aged 65 years and older, such as Qatar, Uganda, and Afghanistan.
But over time, almost all countries are expected to see their older population segments grow. In just three decades, it is estimated that one-in-four European, North American, and Asian residents will be over 65 years of age.
By 2100, a variety of Asian countries and island nations facing low population growth are expected to see more than one-third of their populations aged 65 years or older, including South Korea and Jamaica at 44%. However, it’s actually Albania that’s the biggest outlier overall, with a projected 49% of its population to be aged 65 and older by 2100.
Passing the Generational Torch
The challenge of an aging population is set to impact all sectors of society, including labor and financial markets, demand for housing and transportation, and especially family structures and intergenerational ties.
One way to help grasp the nature of transition is to note the changing ratio between seniors and young children in the world population, as seen in the below crossover diagram:
Dropping fertility rates, in addition to improved child and infant mortality rates, are known to have played a major role in the plateauing population of children.
However, not all countries have witnessed this crossover yet, as it usually coincides with higher levels of economic development.
As countries such as India, Brazil, and South Africa reach higher levels of per capita income, they will be likely to follow down the paths of more advanced economies, eventually experiencing similar demographic fates and challenges.
-
Batteries2 weeks ago
How EV Adoption Will Impact Oil Consumption (2015-2025P)
-
Money4 weeks ago
Visualizing the Assets and Liabilities of U.S. Banks
-
Money2 weeks ago
Ranked: The Worldโs Top 50 Endowment Funds
-
Money4 weeks ago
Visualized: Real Interest Rates by Country
-
United States2 weeks ago
Charting the Rise of America’s Debt Ceiling
-
Central Banks3 weeks ago
Comparing the Speed of Interest Rate Hikes (1988-2023)
-
Misc2 weeks ago
Ranked: The Cities with the Most Skyscrapers in 2023
-
War3 weeks ago
Map Explainer: Sudan