Markets
Animation: Berkshire Hathaway’s Holdings Since 1994
Article/Editing:
Visualizing Berkshire Hathaway’s Holdings Since 1994
If you’re a long-time follower of Visual Capitalist, then you probably know that we’re big fans of Warren Buffett.
We’ve written numerous articles about the world-famous investor, covering everything from his early years to his most famous quotes. As one of the wealthiest and most influential investors in the world, he’s an important market player to keep track of.
As our latest addition to the Warren Buffett archives, this animated video by Sjoerd Tilmans highlights three decades of Warren Buffett’s investments. It shows what his holding company, Berkshire Hathaway, has been invested in since 1994, using data from the company’s financial reports.
A Rocky Start: The Early Years of Berkshire Hathaway
Before becoming the multinational conglomerate that it is today, Berkshire Hathaway was once a massive (yet struggling) textile company in Rhode Island.
Buffett first invested in the company in the late 1950s, when the company’s shares were declining. By 1964, things still hadn’t picked up for the company, and Buffett was ready to cut his losses and move on.
But when industrialist Seabury Stanton, the CEO of Berkshire Hathaway at the time, offered to buy Buffett out for less than the price he’d originally promised, things got interesting. Buffett was so furious by the offer that instead of selling his shares, he bought more, eventually taking control of the company and letting Stanton go.
The textile company never recovered, and Berkshire Hathaway eventually became Buffett’s holding company for other investments. He estimates that his investment in Berkshire Hathaway ultimately cost him $200 billion.
A Brighter Future: Berkshire Hathaway Now
Despite its tumultuous past, Berkshire Hathaway is now associated with tremendous financial success. In 2021, the conglomerate generated over $276 billion in total revenue.
And Buffett has about a 38% stake in the company, which means he’s one of the wealthiest people on the planet. As of today’s publication date, his net worth sits at $93.3 billion.
In the long run, Berkshire Hathaway has outperformed the market by a landslide. Here’s a look at the holding company’s compounded annual gain, and overall gain, compared to the S&P 500:
| Berkshire Hathaway | S&P 500 | |
|---|---|---|
| Compounded Annual Gain (1965-2021) | 20.1% | 10.5% |
| Overall Gain (1964-2021) | 3,641,613% | 30,209% |
Note: These figures are from Berkshire Hathaway’s (BH) Annual Report. BH’s market value is after-tax, and S&P 500 is pre-tax, including dividends.
According to the conglomerate’s website, it owns 62 different companies outright, including big names like GEICO, Dairy Queen, Kraft Heinz, and Duracell, and also has large investments in companies like Apple, Wells Fargo, and Coca-Cola.
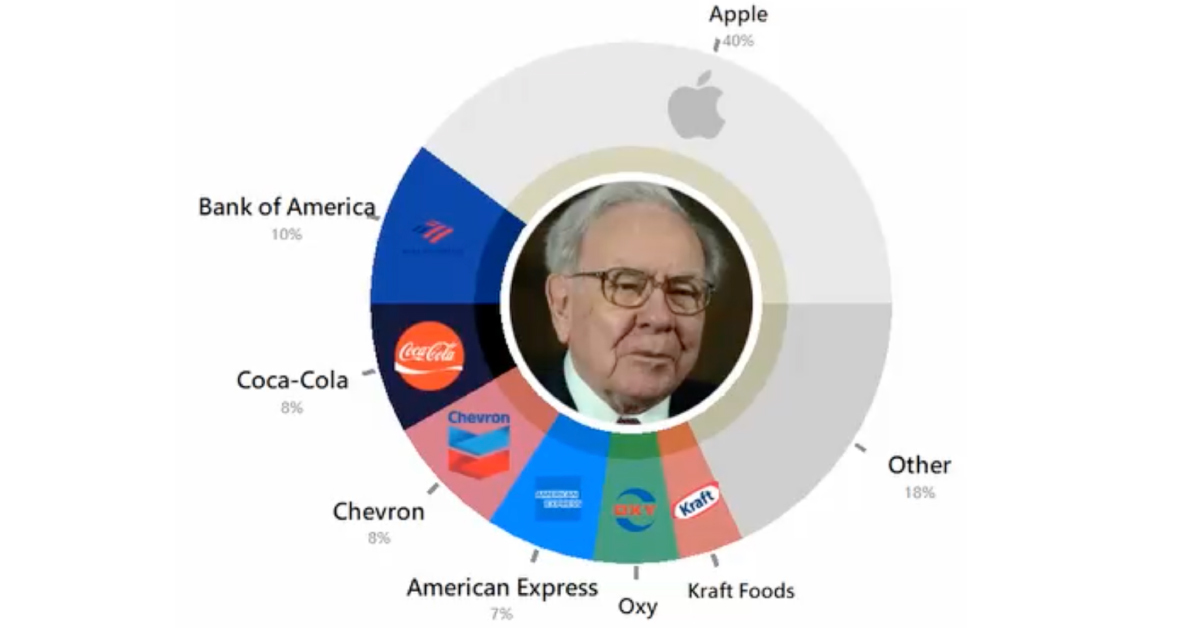
However, as the graphic above indicates, the exact composition of its portfolio has certainly evolved over the years. As of June 2022, here’s a breakdown of Berkshire Hathaway Holdings:
| Company | Value (Millions) | % of Portfolio |
|---|---|---|
| Apple | $122,337 | 40% |
| American Express | $21,016 | 7% |
| Bank of America | $31,444 | 10% |
| Coca-Cola | $25,164 | 8% |
| Chevron | $23,373 | 8% |
| Kraft Foods | $12,419 | 4% |
| Other | $71,559 | 23% |
It’s a well-balanced portfolio of big tech, banks, and consumer goods. Despite being 92 years old, Buffett remains the chairman and CEO of the conglomerate.
As for future succession plans, Greg Abel has been selected as the successor to Buffett as CEO, while the the Guardian has reported that Buffett’s oldest son Howard is expected to take over as non-executive chair when his father is no longer in charge.

This article was published as a part of Visual Capitalist's Creator Program, which features data-driven visuals from some of our favorite Creators around the world.


Markets
U.S. Debt Interest Payments Reach $1 Trillion
U.S. debt interest payments have surged past the $1 trillion dollar mark, amid high interest rates and an ever-expanding debt burden.


U.S. Debt Interest Payments Reach $1 Trillion
This was originally posted on our Voronoi app. Download the app for free on iOS or Android and discover incredible data-driven charts from a variety of trusted sources.
The cost of paying for America’s national debt crossed the $1 trillion dollar mark in 2023, driven by high interest rates and a record $34 trillion mountain of debt.
Over the last decade, U.S. debt interest payments have more than doubled amid vast government spending during the pandemic crisis. As debt payments continue to soar, the Congressional Budget Office (CBO) reported that debt servicing costs surpassed defense spending for the first time ever this year.
This graphic shows the sharp rise in U.S. debt payments, based on data from the Federal Reserve.
A $1 Trillion Interest Bill, and Growing
Below, we show how U.S. debt interest payments have risen at a faster pace than at another time in modern history:
| Date | Interest Payments | U.S. National Debt |
|---|---|---|
| 2023 | $1.0T | $34.0T |
| 2022 | $830B | $31.4T |
| 2021 | $612B | $29.6T |
| 2020 | $518B | $27.7T |
| 2019 | $564B | $23.2T |
| 2018 | $571B | $22.0T |
| 2017 | $493B | $20.5T |
| 2016 | $460B | $20.0T |
| 2015 | $435B | $18.9T |
| 2014 | $442B | $18.1T |
| 2013 | $425B | $17.2T |
| 2012 | $417B | $16.4T |
| 2011 | $433B | $15.2T |
| 2010 | $400B | $14.0T |
| 2009 | $354B | $12.3T |
| 2008 | $380B | $10.7T |
| 2007 | $414B | $9.2T |
| 2006 | $387B | $8.7T |
| 2005 | $355B | $8.2T |
| 2004 | $318B | $7.6T |
| 2003 | $294B | $7.0T |
| 2002 | $298B | $6.4T |
| 2001 | $318B | $5.9T |
| 2000 | $353B | $5.7T |
| 1999 | $353B | $5.8T |
| 1998 | $360B | $5.6T |
| 1997 | $368B | $5.5T |
| 1996 | $362B | $5.3T |
| 1995 | $357B | $5.0T |
| 1994 | $334B | $4.8T |
| 1993 | $311B | $4.5T |
| 1992 | $306B | $4.2T |
| 1991 | $308B | $3.8T |
| 1990 | $298B | $3.4T |
| 1989 | $275B | $3.0T |
| 1988 | $254B | $2.7T |
| 1987 | $240B | $2.4T |
| 1986 | $225B | $2.2T |
| 1985 | $219B | $1.9T |
| 1984 | $205B | $1.7T |
| 1983 | $176B | $1.4T |
| 1982 | $157B | $1.2T |
| 1981 | $142B | $1.0T |
| 1980 | $113B | $930.2B |
| 1979 | $96B | $845.1B |
| 1978 | $84B | $789.2B |
| 1977 | $69B | $718.9B |
| 1976 | $61B | $653.5B |
| 1975 | $55B | $576.6B |
| 1974 | $50B | $492.7B |
| 1973 | $45B | $469.1B |
| 1972 | $39B | $448.5B |
| 1971 | $36B | $424.1B |
| 1970 | $35B | $389.2B |
| 1969 | $30B | $368.2B |
| 1968 | $25B | $358.0B |
| 1967 | $23B | $344.7B |
| 1966 | $21B | $329.3B |
Interest payments represent seasonally adjusted annual rate at the end of Q4.
At current rates, the U.S. national debt is growing by a remarkable $1 trillion about every 100 days, equal to roughly $3.6 trillion per year.
As the national debt has ballooned, debt payments even exceeded Medicaid outlays in 2023—one of the government’s largest expenditures. On average, the U.S. spent more than $2 billion per day on interest costs last year. Going further, the U.S. government is projected to spend a historic $12.4 trillion on interest payments over the next decade, averaging about $37,100 per American.
Exacerbating matters is that the U.S. is running a steep deficit, which stood at $1.1 trillion for the first six months of fiscal 2024. This has accelerated due to the 43% increase in debt servicing costs along with a $31 billion dollar increase in defense spending from a year earlier. Additionally, a $30 billion increase in funding for the Federal Deposit Insurance Corporation in light of the regional banking crisis last year was a major contributor to the deficit increase.
Overall, the CBO forecasts that roughly 75% of the federal deficit’s increase will be due to interest costs by 2034.

-

 Maps2 weeks ago
Mapped: Average Wages Across Europe
-

 Money1 week ago
Which States Have the Highest Minimum Wage in America?
-

 Real Estate1 week ago
Ranked: The Most Valuable Housing Markets in America
-

 Markets1 week ago
Charted: Big Four Market Share by S&P 500 Audits
-

 AI1 week ago
The Stock Performance of U.S. Chipmakers So Far in 2024
-

 Misc2 weeks ago
Almost Every EV Stock is Down After Q1 2024
-

 Money2 weeks ago
Where Does One U.S. Tax Dollar Go?
-

 Green2 weeks ago
Ranked: Top Countries by Total Forest Loss Since 2001