Healthcare
Visualizing Healthcare Spending by Country
var divElement = document.getElementById(‘viz1568415413550’); var vizElement = divElement.getElementsByTagName(‘object’)[0]; vizElement.style.width=’100%’;vizElement.style.height=’1020px’; var scriptElement = document.createElement(‘script’); scriptElement.src = ‘https://public.tableau.com/javascripts/api/viz_v1.js’; vizElement.parentNode.insertBefore(scriptElement, vizElement);
How Much Do OECD Countries Spend on Healthcare?
When you start feeling ill, the first line of defense is typically to have a doctor assess the symptoms—but how much you end up paying for a visit differs greatly by region.
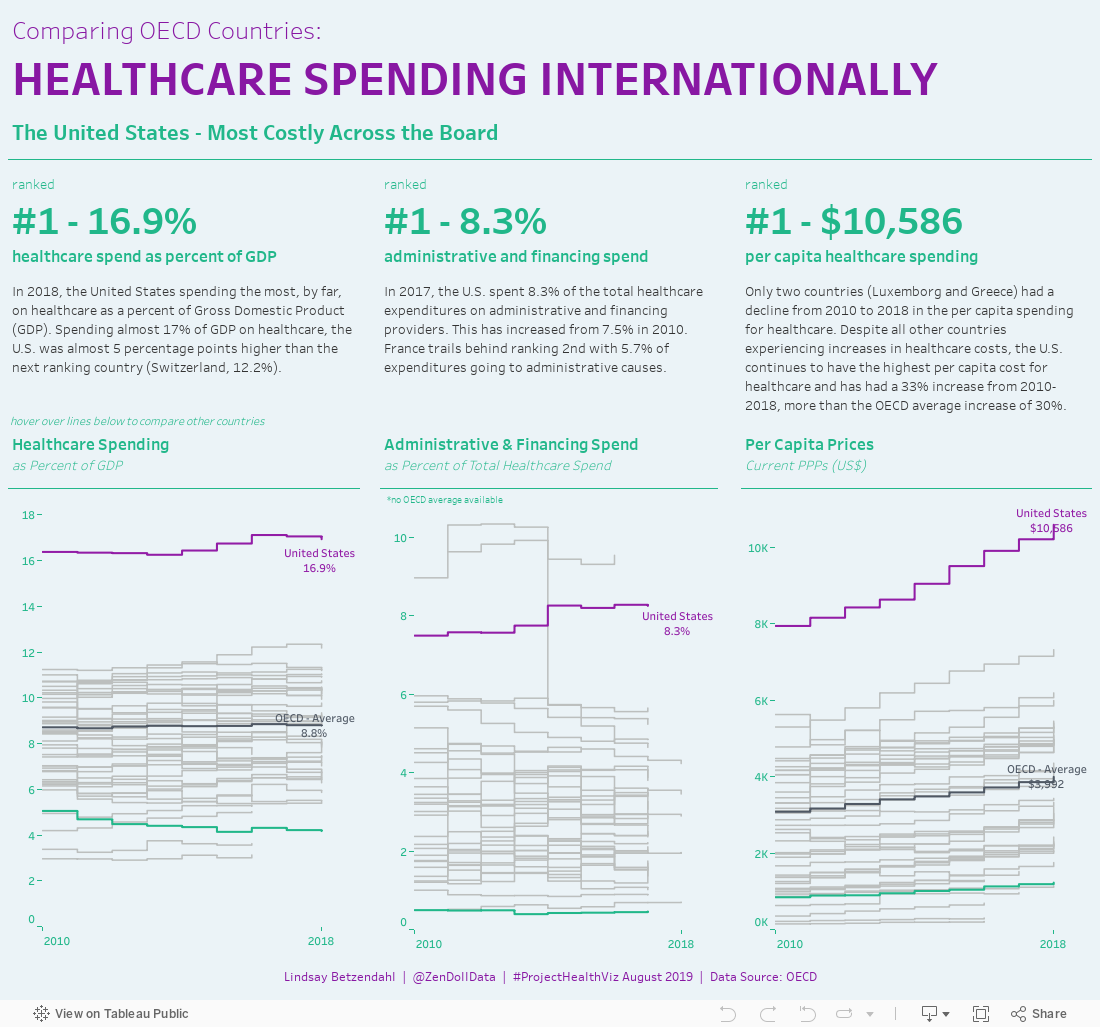
Today’s interactive visualization was created by HealthDataViz consultant Lindsay Betzendahl, who also founded #ProjectHealthViz. The data considers how healthcare spending by country stacks up across the 36 Organization for Economic Cooperation (OECD) members, and how it has changed since 2010.
One thing is clear—the United States comes in first place in each category, but that’s not necessarily a good thing:
| 🇺🇸 United States | 🌐 OECD Average | |
|---|---|---|
| Healthcare Spending (% of GDP) | 16.9% (#1) | 8.8% |
| Admin Costs as % of Health Spend | 8.3% (#1)* | ~3% |
| Per Capita Prices (Current PPPs, USD) | $10,586 (#1) | $3,992 |
*Although Costa Rica’s figure was higher in 2016, more recent data is not yet available.
Let’s look at each individual cost category, to see what else we can learn.
What Portion of GDP Goes Towards Health?
Population health is a strong determinant in quality of life. As such, how much a country spends on healthcare as a percentage of gross domestic product (GDP) can be an important indicator.
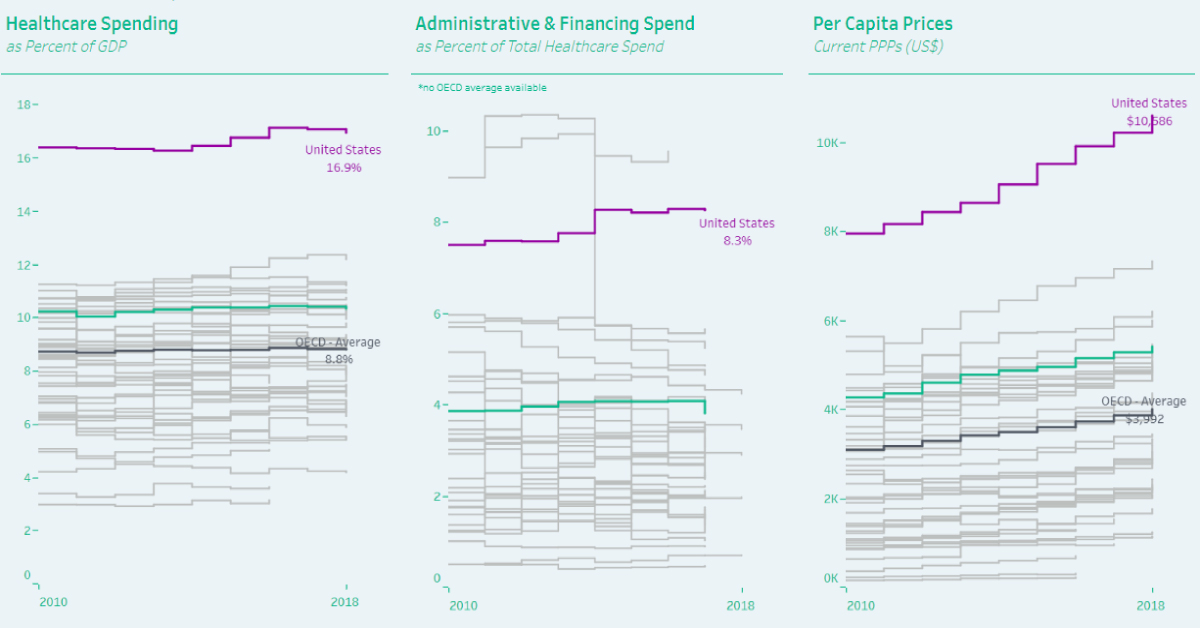
The U.S. spends 16.9% of GDP on its healthcare, nearly double the OECD average of 8.8%. That’s also over 4 percentage points (p.p.) above Switzerland, which ranks second with 12.2% healthcare spending by GDP.
The problem? While Switzerland consistently ranks as having one of the best healthcare systems in the world, the U.S. lags behind—which means that expenditures are not always translating into better health outcomes for patients.
Where’s the Money Going?
Looking after the health of millions of people is a lot of work, and this is where spending on healthcare administration and financing comes into play. Funds are allocated to medical resource providers, who manage everything from health records to salaries and insurance bills.
The U.S. spends about 8.3% of its total healthcare expenditures on these complex costs today, which is a marginal increase from 7.5% in 2010. Interestingly, Costa Rica’s healthcare spending on the same metric was even higher in 2016, at 9.5% of the total.
On the bright side, Mexico has been making strides in the past few years: administrative spending plunged from 10.3% in 2013, down to 4.6% in 2017.
Globally, advancements in health-tech are helping to reduce costs by streamlining tedious processes. However, it’s still not enough—and these immense costs trickle down to patients.
How Much Does Each Person Shell Out?
Over the past eight years, a majority of OECD countries have seen their healthcare spending per capita climb, with Luxembourg and Greece being the only exceptions. The average OECD country’s spend was $3,992 per capita in 2018, up from $3,080 in 2010—nearly a 30% increase.
However, the U.S. experiences the most dramatic sticker shock by far. At $10,586 per head, the U.S. average is already more than double the OECD average. What’s more, this is a 33.3% increase from $7,939 in healthcare spending per capita in 2010.
As the U.S. healthcare reform debate around prices and quality of care rages on, it’s important to remember that healthy people are the backbone of any country’s long-term economic growth.


Healthcare
The Cost of an EpiPen in Major Markets
This visualization compares EpiPen prices around the world, with the U.S. having the highest prices by far.


The Cost of an EpiPen in Major Markets
This was originally posted on our Voronoi app. Download the app for free on iOS or Android and discover incredible data-driven charts from a variety of trusted sources.
EpiPens are auto-injectors containing epinephrine, a drug that can treat or reverse severe allergic reactions, potentially preventing death.
The global epinephrine market was valued at $1.75 billion in 2022 and is projected to reach $4.08 billion by 2030. North America represents over 60% of the market.
EpiPens, however, can be prohibitively expensive in some regions.
In this graphic, we present estimated EpiPen prices in major global markets, compiled by World Population Review and converted to U.S. dollars as of August 2023.
Why are U.S. Prices so High?
The U.S. stands out as the most expensive market for EpiPens, despite over 1 million Americans having epinephrine prescriptions. After Mylan (now part of Pfizer) acquired the rights to produce EpiPens in the U.S. in 2007, the cost of a two-pack skyrocketed to $600, up from about $60.
| Country | Price (USD) |
|---|---|
| 🇺🇸 U.S. | 300* |
| 🇯🇵 Japan | 98 |
| 🇩🇪 Germany | 85 |
| 🇨🇦 Canada | 80 |
| 🇫🇷 France | 76 |
| 🇦🇺 Australia | 66 |
| 🇬🇧 UK | 61 |
| 🇮🇳 India | 30 |
*Per unit cost. Commonly sold as a two-pack, meaning total cost is equal to $600
Former Mylan CEO Heather Bresch defended the price hikes to Congress, citing minimal profit margins. Mylan eventually settled with the U.S. government for a nine-figure sum.
Notably, EpiPens are available at a fraction of the cost in other developed countries like Japan, Germany, and Canada.
Making EpiPens More Affordable
Efforts to improve EpiPen affordability are underway in several U.S. states. For instance, the Colorado House approved a $60 price cap on epinephrine, now under review by the state Senate.
Similar measures in Rhode Island, Delaware, Missouri, and Vermont aim to ensure insurance coverage for epinephrine, which is not currently mandatory, although most health plans cover it.

-

 Brands6 days ago
How Tech Logos Have Evolved Over Time
-

 Economy2 weeks ago
Where U.S. Inflation Hit the Hardest in March 2024
-

 Green2 weeks ago
Top Countries By Forest Growth Since 2001
-

 United States2 weeks ago
Ranked: The Largest U.S. Corporations by Number of Employees
-

 Maps2 weeks ago
The Largest Earthquakes in the New York Area (1970-2024)
-

 Green2 weeks ago
Ranked: The Countries With the Most Air Pollution in 2023
-

 Green2 weeks ago
Ranking the Top 15 Countries by Carbon Tax Revenue
-

 Markets2 weeks ago
U.S. Debt Interest Payments Reach $1 Trillion