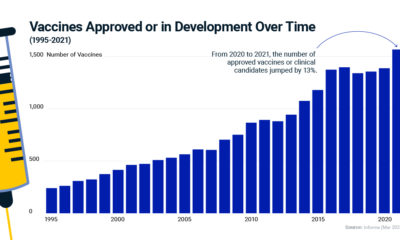

Vaccine development has grown six-fold since 1995. Learn how virology, the study of viruses, is driving innovation in the healthcare industry.
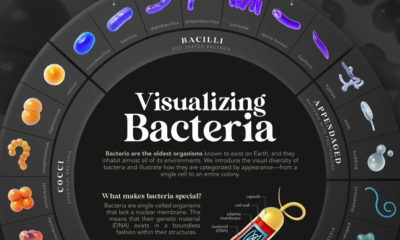

We introduce the visual diversity of bacteria and illustrate how they are categorized by appearance—from a single cell to an entire colony.


How does the COVID-19 Delta variant compare with the original disease? Here are the key differences according to consolidated studies.
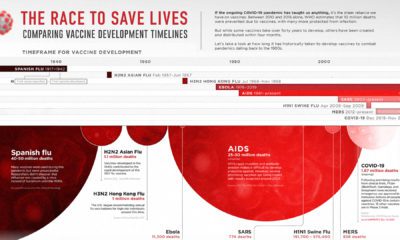

This graphic looks at how long vaccine development has historically taken for pandemics dating back to the 1900s.
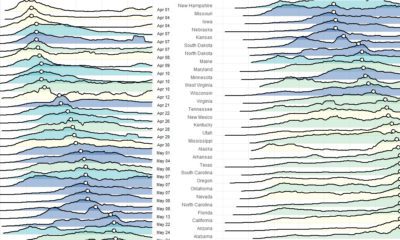

These charts and maps show the evolution of COVID-19's spread in the United States, by organizing data based on peak case and death dates.


