COVID-19
The Race to Save Lives: Comparing Vaccine Development Timelines
View the full-resolution version of this infographic


The Race to Save Lives: Vaccine Development Timelines
View the high-resolution of the infographic by clicking here.
Major advancements in medicine have led to a significant increase in average life expectancy, with vaccines being hailed as one of the most successful interventions to date.
In fact, the World Health Organization estimates that vaccines have prevented 10 million deaths between 2010 and 2015 alone. But while some were created and distributed in just over four months, others have taken over 40 years to develop. Then again, previous pandemics have petered out without any vaccine at all.
With approved COVID-19 vaccines soon to be distributed across the globe, the vaccine development process is being scrutinized by experts (and non-experts) the world over.
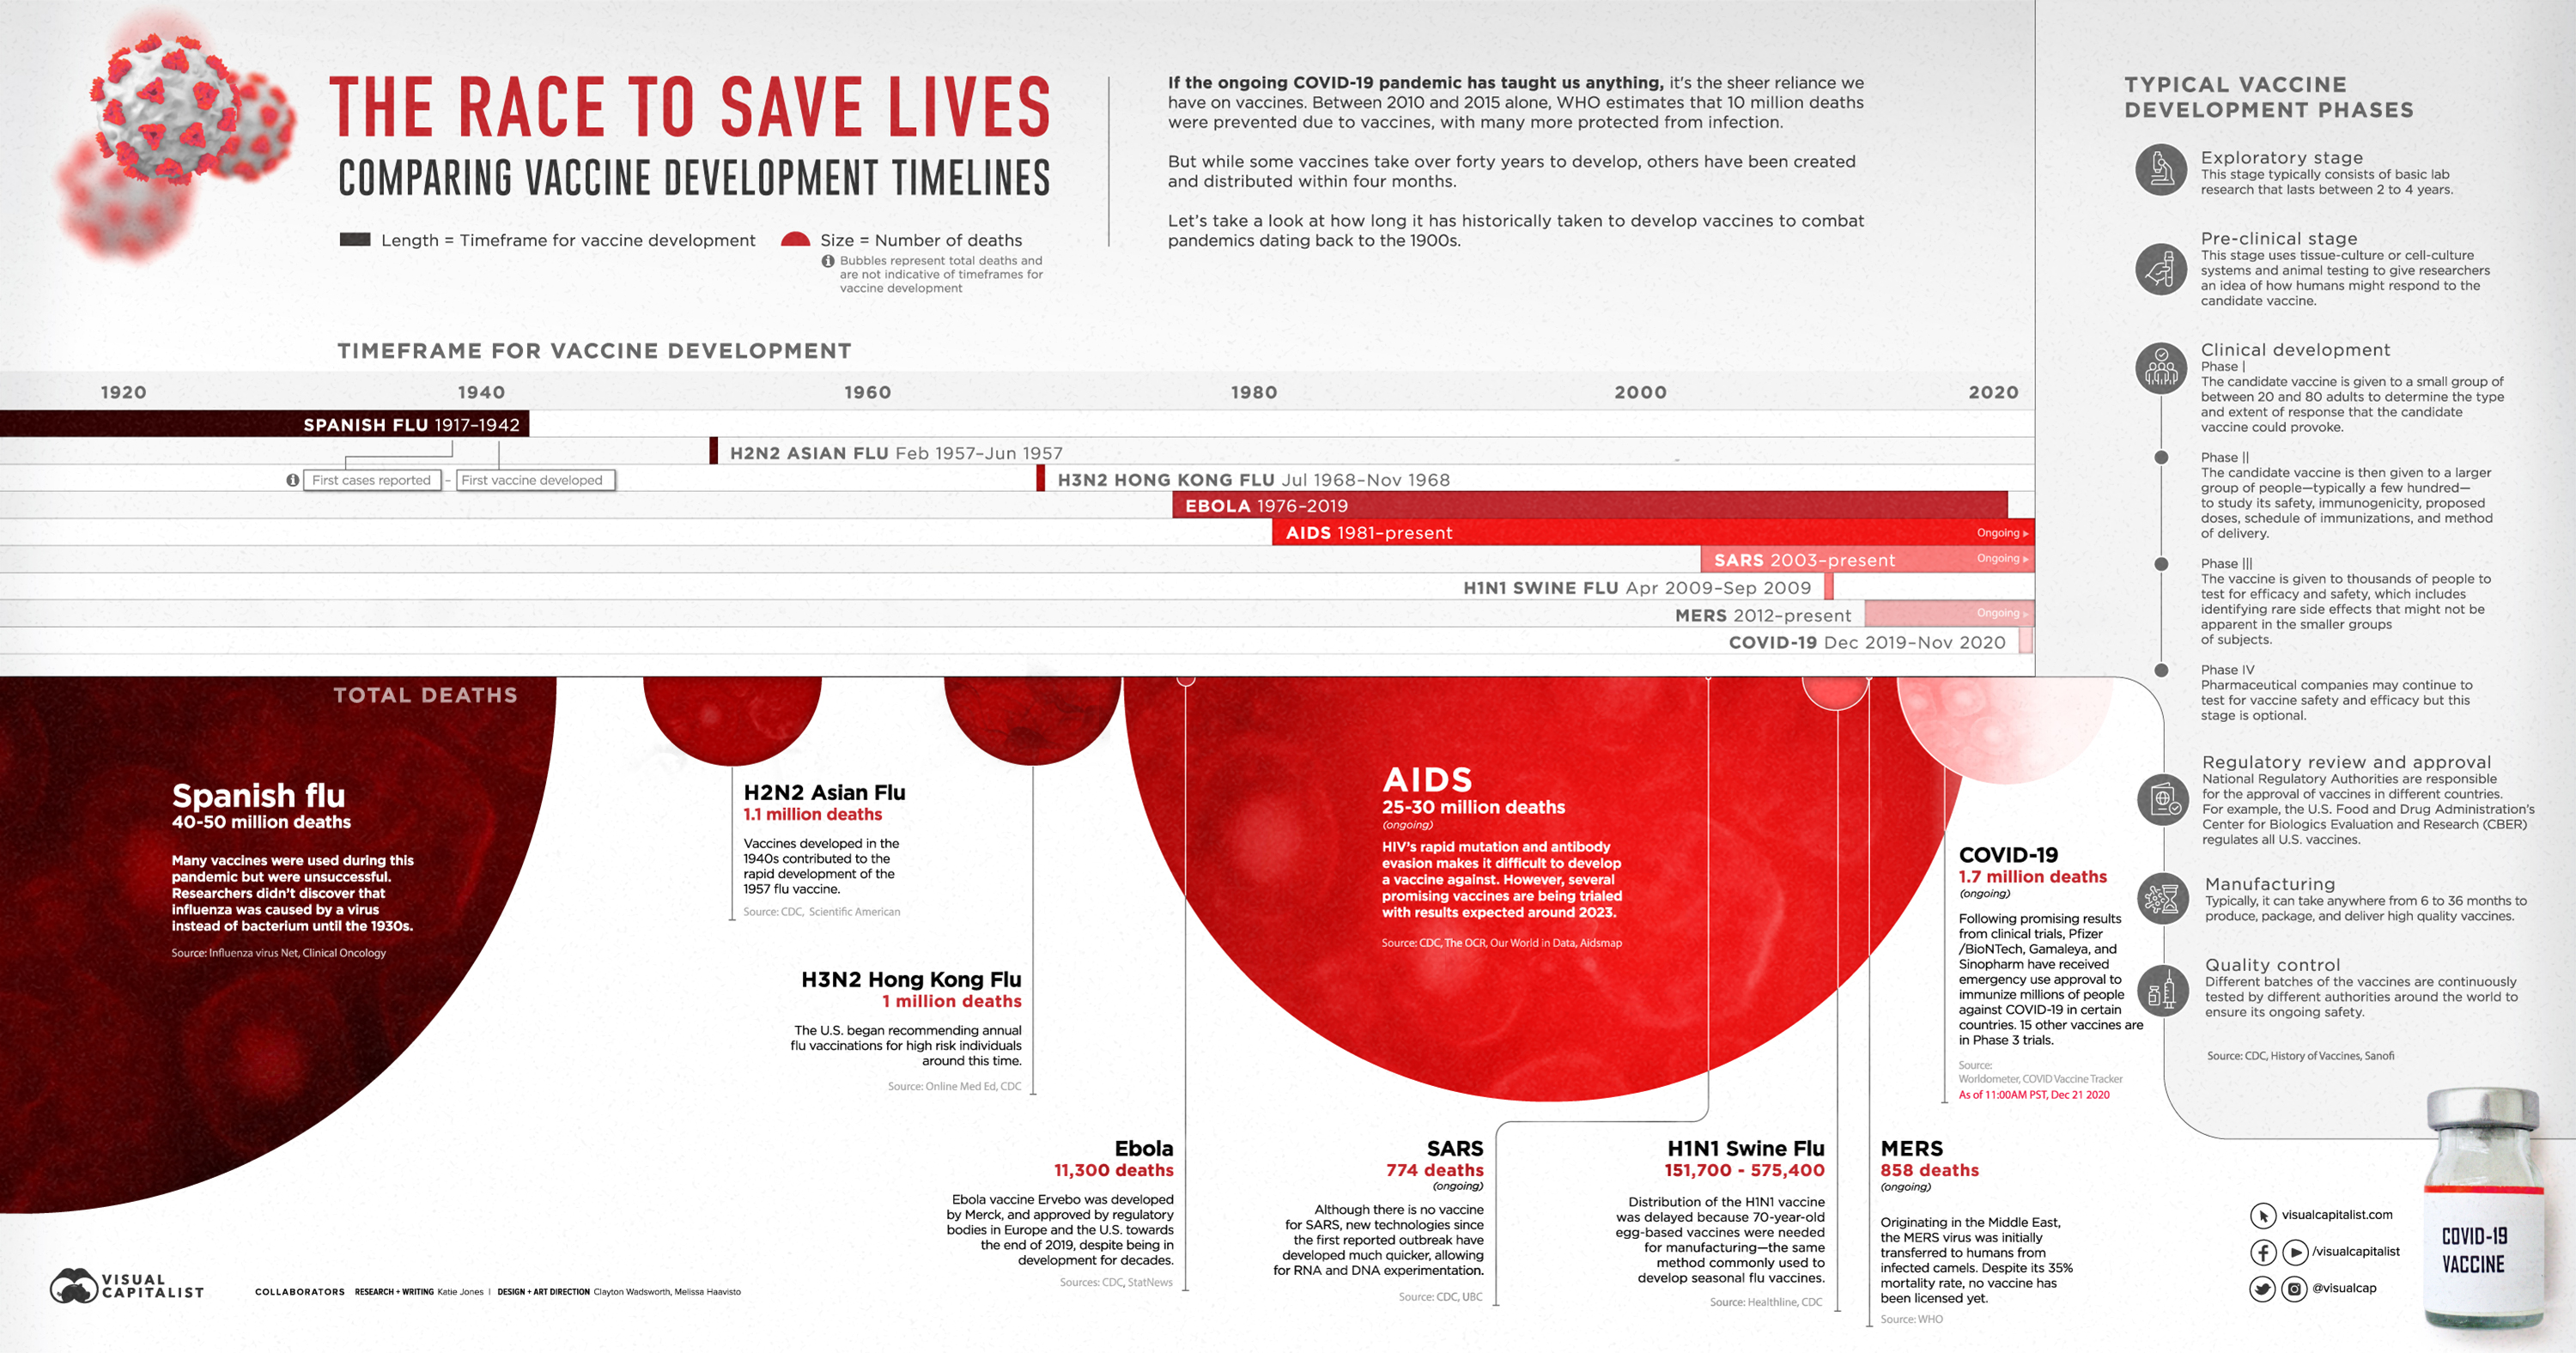
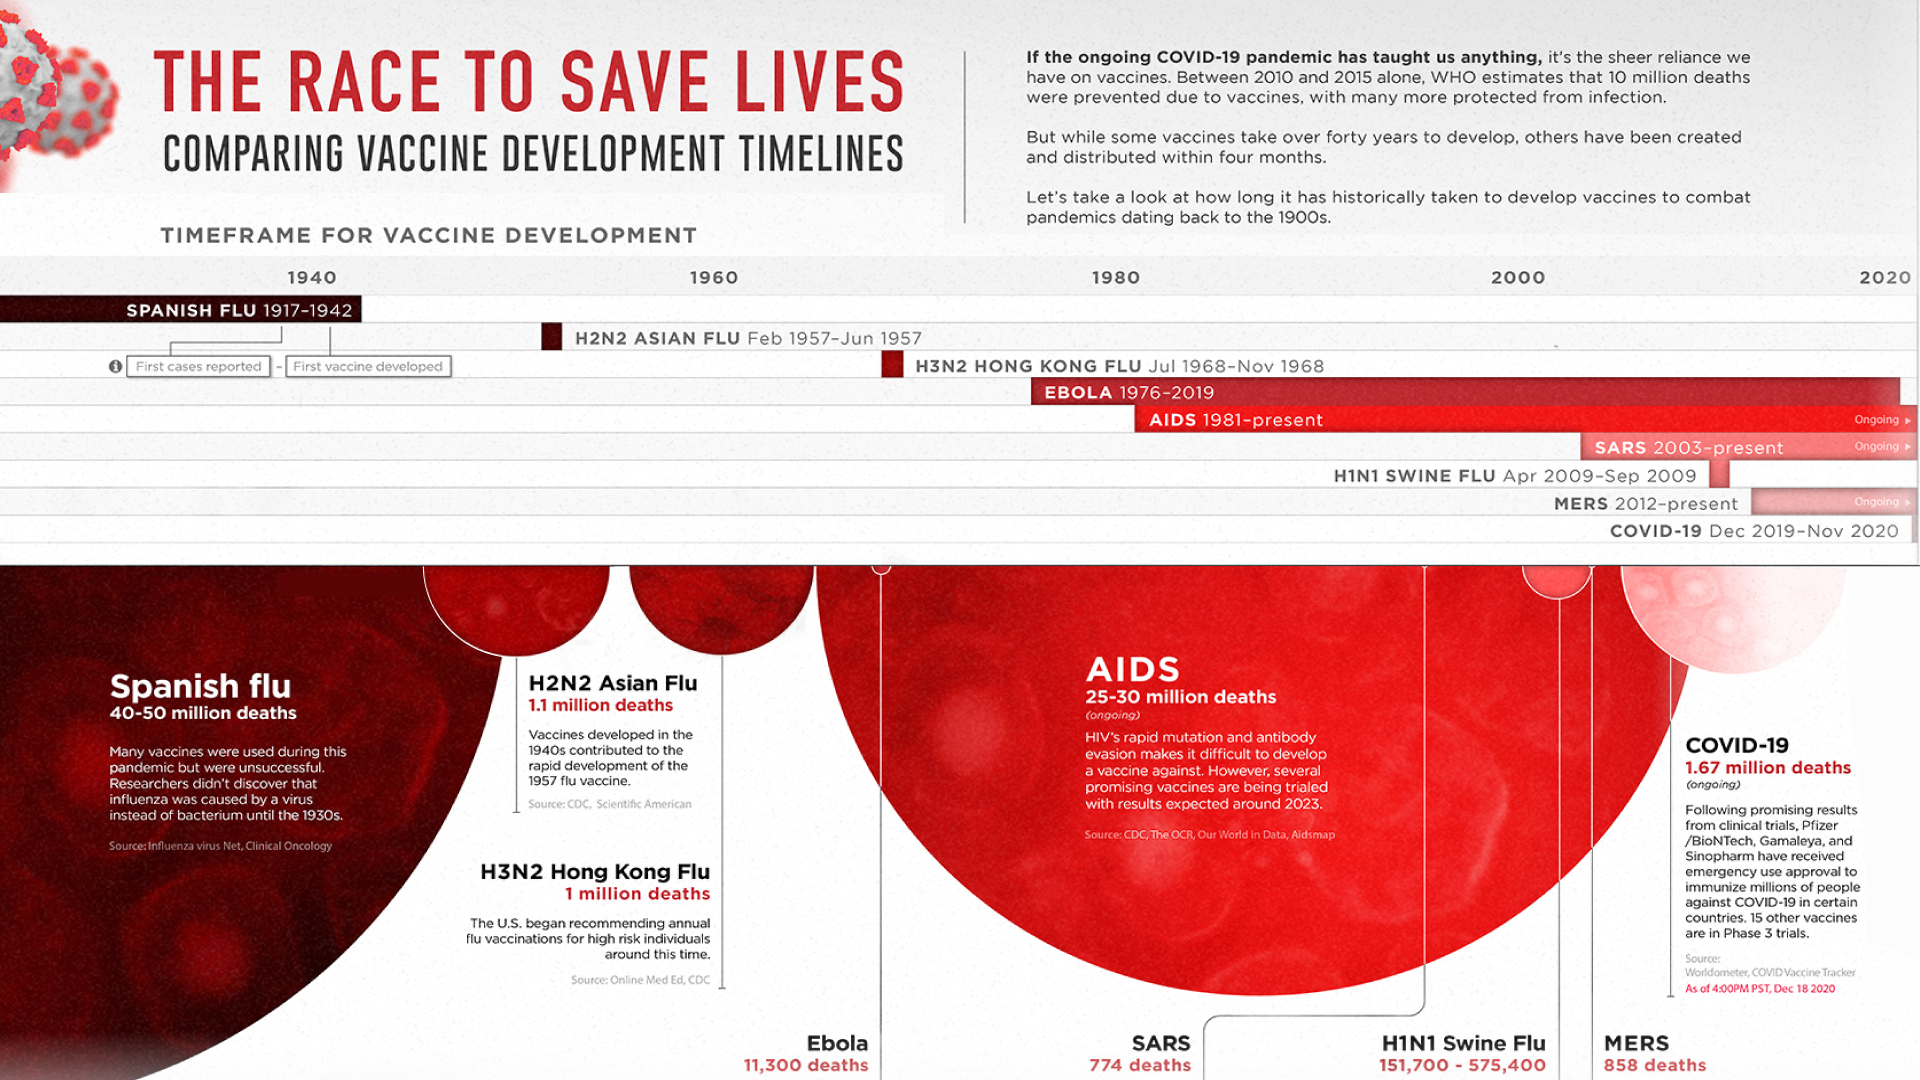
In the graphic above, we explore how long it has historically taken to bring a vaccine to market during pandemics dating back to the 1900s, and what the process entails.
Pandemic Vaccines of the Past
Although the assumption can be made that developing a vaccine for infectious diseases has become more efficient since the 1900s, that statement is not entirely correct.
It took approximately 25 years to develop a vaccine for the Spanish Flu which killed between 40-50 million people. Similarly, it was only last year that the FDA approved the first Ebola vaccine—an effort that took 43 years since the discovery of the virus.
But while scientists and medical experts have made headway in stopping major pandemics in their tracks, some of the worst outbreaks in history have yet to be cured.
Here is a closer look at the timeframes for vaccine development for every pandemic since the turn of the 20th century:
| Name of Pandemic | Death Toll | Timeframe for Vaccine Development | Duration |
|---|---|---|---|
| Spanish flu | 40-50 million | 1917-1942 | 25 years |
| H2N2 Asian flu | 1.1 million | Feb 1957-Jun 1957 | <5 months |
| H3N2 Hong Kong Flu | 1 million | Jul 1968-Nov 1968 | <5 months |
| SARS | 774 (ongoing) | 2003-present | 17 years (ongoing) |
| Ebola | 11,300 | 1976-2019 | 43 years |
| AIDS | 25-35 million (ongoing) | 1981-present | 39 years (ongoing) |
| H1N1 Swine Flu | 151,700 - 575,400 | Apr 2009-Sept 2009 | 6 months |
| MERS | 858 (ongoing) | 2012-present | 8 years (ongoing) |
| Coronavirus | 1.64 million (ongoing) | Dec 2019-Nov 2020 | 11 months |
When it comes to the speedy development of a COVID-19 vaccine, funding has played a vital role. With case numbers growing at an alarming rate, demand and urgency for a vaccine are high. In the U.S., the government paid Pfizer and BioNTech almost $2 billion for 100 million doses of a safe vaccine for COVID-19. This level of support from governments the world over means that pharmaceutical giants have less financial uncertainties to deal with compared to other vaccines.
Even though the global endeavor to distribute COVID-19 vaccines is now underway, many experts are concerned that the pace of approval could compromise long-term safety—but there are rigorous steps a vaccine must first go through before it is approved.
The Journey of a Vaccine Candidate
On average, it takes 10 years to develop a vaccine. According to the CDC, there are six stages involved in the process from start to finish:
- Exploratory stage: This stage typically consists of basic lab research that can last anywhere from 2 to 4 years.
- Pre-clinical stage: This stage uses tissue-culture or cell-culture systems and animal testing to give researchers an idea of how humans might respond to a candidate vaccine.
- Clinical development: Within the clinical development stage, there are three phases. Phase 1 examines the response of a small group of people to a candidate vaccine. Phase 2 involves giving the candidate vaccine to a larger group of people to study its safety, immunogenicity, proposed doses, schedule of immunizations, and method of delivery. In Phase 3, the vaccine is given to thousands of people to further test for efficacy and safety.
- Regulatory review and approval: National Regulatory Authorities are responsible for the approval of vaccines in different countries. For example, the U.S. Food and Drug Administration’s Center for Biologics Evaluation and Research (CBER) regulates all U.S. vaccines.
- Manufacturing: Typically, it can take anywhere from 6 to 36 months to produce, package, and deliver a high quality vaccine.
- Quality control: Different batches of a vaccine are continuously tested by different authorities around the world to ensure its ongoing safety.
Despite these lengthy timeframes, the COVID-19 vaccines and subsequent candidates have overturned the conventional process due to their unconventional technology.
Innovative Technologies Driving COVID’s Cure
Even though there are no approved vaccines for other coronaviruses such as MERS and SARS, previous research into these diseases has helped identify potential solutions for COVID-19 using messenger RNA (mRNA) technology.
“The mRNA vaccine platform technology [which the Pfizer/BioNTech vaccine uses] has been in development for over two decades.”
—Dr Zoltán Kis, Imperial College London.
The technology instructs our bodies to produce a small part of the COVID-19 virus called a spike protein. This triggers the immune system to make antibodies to fight against it and prepares the body for an actual COVID-19 infection.
Containing COVID-19 Batch-by-Batch
Deployment of a safe and effective vaccine could have the potential to save millions of lives and prevent infection for many more.
Although some experts have criticized the speed of vaccine candidate approvals, the quality will be closely monitored on a batch-by-batch basis.
With the COVID-19 crisis showing no signs of slowing down, most of us continue to live in hope that the light is at the end of the tunnel.


Healthcare
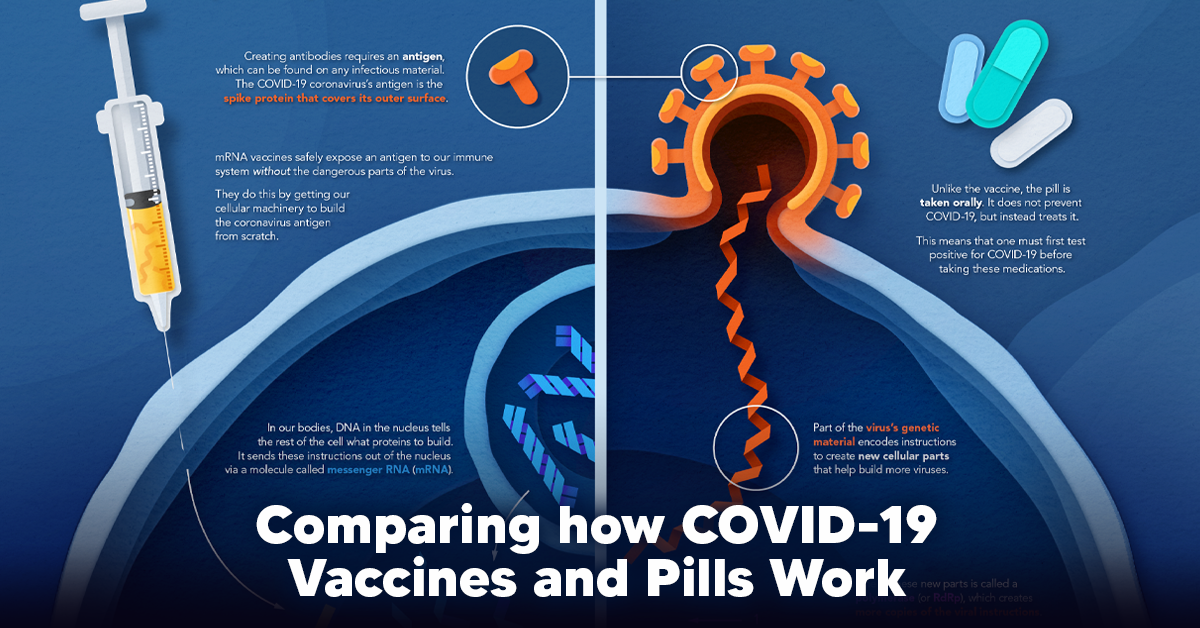
Visualizing How COVID-19 Antiviral Pills and Vaccines Work at the Cellular Level
Despite tackling the same disease, vaccines and antiviral pills work differently to combat COVID-19. We visualize how they work in the body.
Current Strategies to Tackle COVID-19
Since the pandemic started in 2020, a number of therapies have been developed to combat COVID-19.
The leading options for preventing infection include social distancing, mask-wearing, and vaccination. They are still recommended during the upsurge of the coronavirus’s latest mutation, the Omicron variant.
But in December 2021, The United States Food and Drug Administration (USDA) granted Emergency Use Authorization to two experimental pills for the treatment of new COVID-19 cases.
These medications, one made by Pfizer and the other by Merck & Co., hope to contribute to the fight against the coronavirus and its variants. Alongside vaccinations, they may help to curb extreme cases of COVID-19 by reducing the need for hospitalization.
Despite tackling the same disease, vaccines and pills work differently:
| Vaccines | Pills |
|---|---|
| Taken by injection | Taken by mouth |
| Used for prevention | Used for treatment only |
| Create an enhanced immune system by stimulating antibody production | Disrupt the assembly of new viral particles |
How a Vaccine Helps Prevent COVID-19
The main purpose of a vaccine is to prewarn the body of a potential COVID-19 infection by creating antibodies that target and destroy the coronavirus.
In order to do this, the immune system needs an antigen.
It’s difficult to do this risk-free since all antigens exist directly on a virus. Luckily, vaccines safely expose antigens to our immune systems without the dangerous parts of the virus.
In the case of COVID-19, the coronavirus’s antigen is the spike protein that covers its outer surface. Vaccines inject antigen-building instructions* and use our own cellular machinery to build the coronavirus antigen from scratch.
When exposed to the spike protein, the immune system begins to assemble antigen-specific antibodies. These antibodies wait for the opportunity to attack the real spike protein when a coronavirus enters the body. Since antibodies decrease over time, booster immunizations help to maintain a strong line of defense.
*While different vaccine technologies exist, they all do a similar thing: introduce an antigen and build a stronger immune system.
How COVID Antiviral Pills Work
Antiviral pills, unlike vaccines, are not a preventative strategy. Instead, they treat an infected individual experiencing symptoms from the virus.
Two drugs are now entering the market. Merck & Co.’s Lagevrio®, composed of one molecule, and Pfizer’s Paxlovid®, composed of two.
These medications disrupt specific processes in the viral assembly line to choke the virus’s ability to replicate.
The Mechanism of Molnupiravir
RNA-dependent RNA Polymerase (RdRp) is a cellular component that works similar to a photocopying machine for the virus’s genetic instructions. An infected host cell is forced to produce RdRp, which starts generating more copies of the virus’s RNA.
Molnupiravir, developed by Merck & Co., is a polymerase inhibitor. It inserts itself into the viral instructions that RdRp is copying, jumbling the contents. The RdRp then produces junk.
The Mechanism of Nirmatrelvir + Ritonavir
A replicating virus makes proteins necessary for its survival in a large, clumped mass called a polyprotein. A cellular component called a protease cuts a virus’s polyprotein into smaller, workable pieces.
Pfizer’s antiviral medication is a protease inhibitor made of two pills:
- The first pill, nirmatrelvir, stops protease from cutting viral products into smaller pieces.
- The second pill, ritonavir, protects nirmatrelvir from destruction by the body and allows it to keep working.
With a faulty polymerase or a large, unusable polyprotein, antiviral medications make it difficult for the coronavirus to replicate. If treated early enough, they can lessen the virus’s impact on the body.
The Future of COVID Antiviral Pills and Medications
Antiviral medications seem to have a bright future ahead of them.
COVID-19 antivirals are based on early research done on coronaviruses from the 2002-04 SARS-CoV and the 2012 MERS-CoV outbreaks. Current breakthroughs in this technology may pave the way for better pharmaceuticals in the future.
One half of Pfizer’s medication, ritonavir, currently treats many other viruses including HIV/AIDS.
Gilead Science is currently developing oral derivatives of remdesivir, another polymerase inhibitor currently only offered to inpatients in the United States.
More coronavirus antivirals are currently in the pipeline, offering a glimpse of control on the looming presence of COVID-19.
Author’s Note: The medical information in this article is an information resource only, and is not to be used or relied on for any diagnostic or treatment purposes. Please talk to your doctor before undergoing any treatment for COVID-19. If you become sick and believe you may have symptoms of COVID-19, please follow the CDC guidelines.

-

 Debt1 week ago
How Debt-to-GDP Ratios Have Changed Since 2000
-

 Markets2 weeks ago
Ranked: The World’s Top Flight Routes, by Revenue
-

 Countries2 weeks ago
Population Projections: The World’s 6 Largest Countries in 2075
-

 Markets2 weeks ago
The Top 10 States by Real GDP Growth in 2023
-

 Demographics2 weeks ago
The Smallest Gender Wage Gaps in OECD Countries
-

 United States2 weeks ago
Where U.S. Inflation Hit the Hardest in March 2024
-

 Green2 weeks ago
Top Countries By Forest Growth Since 2001
-

 United States2 weeks ago
Ranked: The Largest U.S. Corporations by Number of Employees