
Biochar has the remarkable potential to absorb roughly 6% of the world's greenhouse gas emissions, here's how.

Wildfires are blazing across the U.S with unprecedented intensity. Here is how activity has evolved over four decades.

Consumers are expecting more this Black Friday, but for retailers, the pressure is mounting. Here are 10 trends that may impact them in 2023.


Generative AI tools are demonstrating massive potential to help, but also to harm. Here are 9 concerns, backed by data.


A backlog of routine and COVID-19 vaccinations has led to skyrocketing demand for syringes. What role will needle-free devices play?

Cultured meat could become a $25 billion market by 2030, but investment into the technologies that underpin the industry is required.
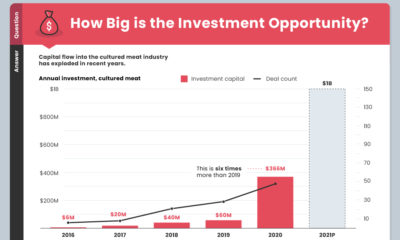

By 2030, the cultured meat market could be worth $25 billion. Before you invest, here are the answers to your burning questions.
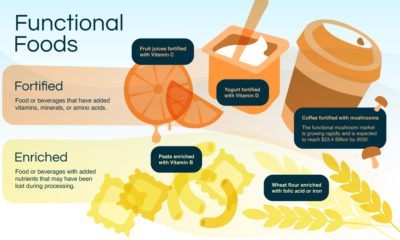

Thanks to the COVID-19 pandemic, functional food is booming. Here's what investors need to know about this exciting $146 billion market.
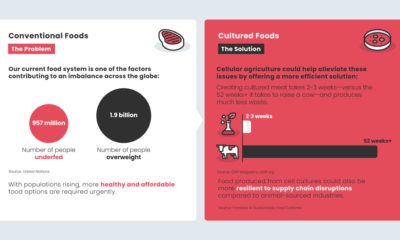

Over $2 billion in investments has been injected into the cultured foods market since 2020. Here are 5 reasons why they're here to stay.
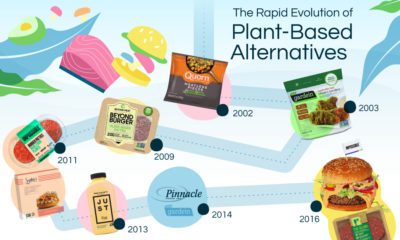

2020 plant-based alternatives sales surpassed $7 billion in the U.S. alone. How did this explosion in plant-based alternatives start?


Feeling disconnected? This infographic teaches you how to build strong leadership communities in your organization in a hybrid working world.
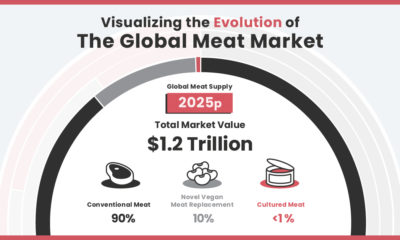

The global meat market will be worth $1.8 trillion by 2040, but how much of that will plant-based alternatives and cultured meat command?
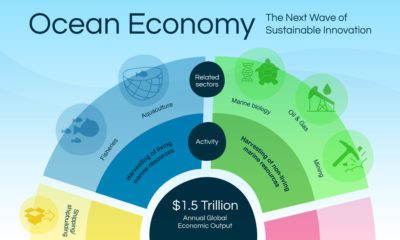

This graphic explores how the $1.5 trillion ocean economy can help fight against some of the toughest challenges facing the world today.
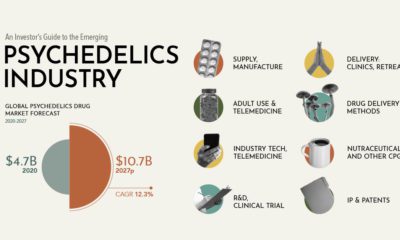

This graphic provides a visual guide to investing in psychedelics, breaking down each sector and the companies that operate within them.


Roughly 80% of teams are seen as mediocre or weak. This graphic explores the strategies leaders can use to create accountable teams.
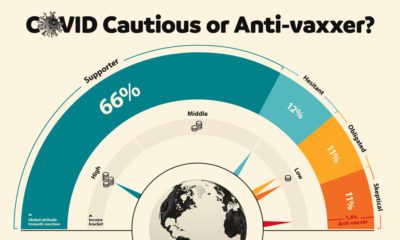

This graphic visualizes global attitudes to vaccines categorized into five segments including anti-vaxxers and COVID cautious.
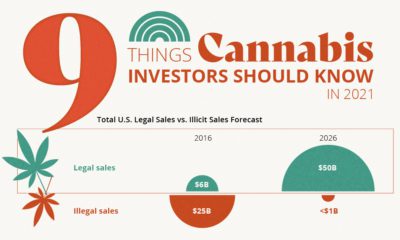

This graphic provides an overview of 9 key developments in the cannabis industry that investors should be aware of going into 2021.
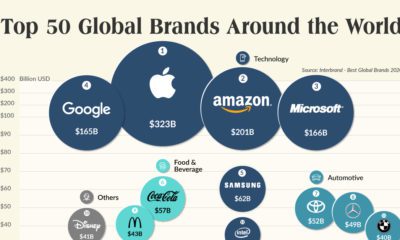

This graphic showcases 2020's top 50 most valuable global brands and explores how COVID-19 has triggered a brand shift with huge implications.

This graphic explores how festive spending in 2020 has changed as a result of the ongoing COVID-19 pandemic and evolving consumer behavior.
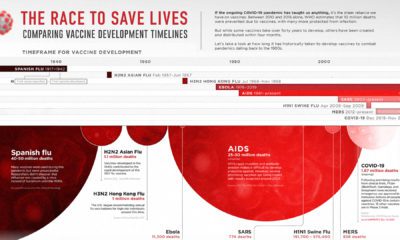

This graphic looks at how long vaccine development has historically taken for pandemics dating back to the 1900s.


This graphic compares consumers’ most loved brands before the COVID-19 pandemic to their most loved brands during the pandemic.
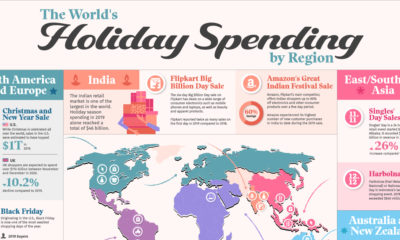

This graphic illustrates some of the largest and most anticipated retail holidays by region and explores their origins.


This graphic illustrates 15 warning signs that job interviewees can use to help identify a toxic work environment before they join the wrong company.
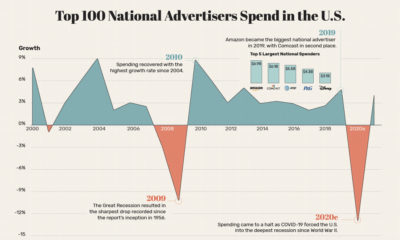

This graphic visualizes the fluctuations in advertising spend in the U.S., along with its brutal decline of 13% as a result of COVID-19.
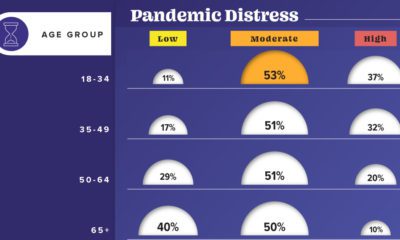

This graphic visualizes the impact of COVID-19 on emotional distress levels by different demographic subgroups such as race, education, or sex.


This infographic delves into five major forces reshaping our world and the new rules of leadership that CEOs should follow as a result.


This graphic charts the American dairy industry's shift in milk production from small commercial farms to fewer, larger farms.
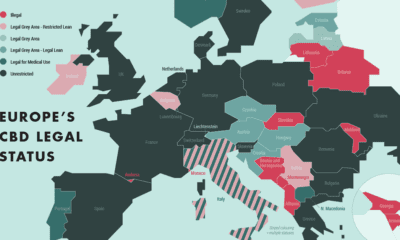

This graphic explains the innately complex legal status of CBD products in Europe and highlights the countries leading the CBD charge.
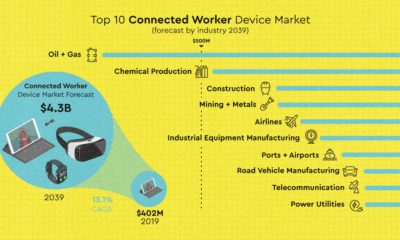

This graphic explores the role connected workers play in achieving successful digital transformation and identifying new growth opportnities.
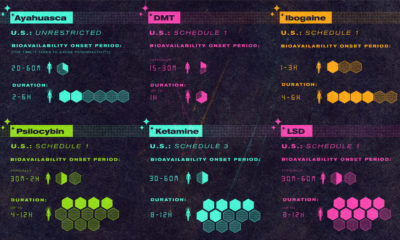

This infographic provides a simple overview of the seven most common psychedelic substances and explores their therapeutic potential.
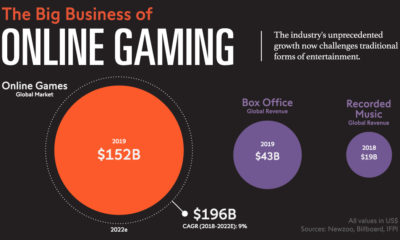

By 2022, the online gaming market is expected to rake in $196 billion in revenue, more than box office and recorded music revenues combined.
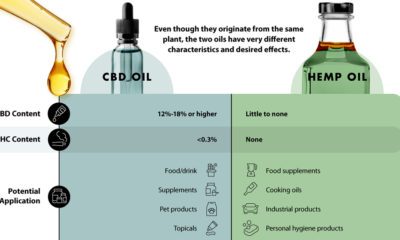

CBD Oil vs. Hemp Oil: What’s the Difference? For many consumers, cannabis plays a significant role in the treatment of medical conditions and managing general well-being....
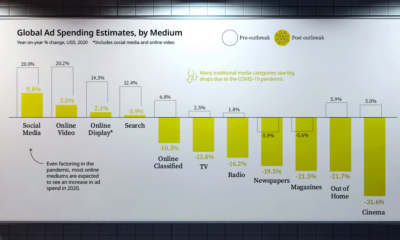

Global advertising spending is estimated to see $50 billion decline across various mediums and industries as a result of COVID-19.
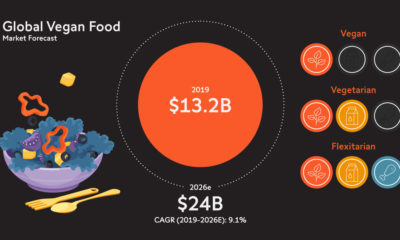

This graphic unearths the origins of the meatless revolution, while exploring how the $1.8 trillion meat market is responding to the threat of disruption.
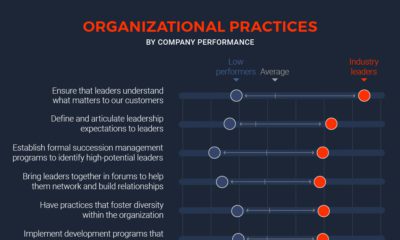

This graphic explores the five behaviors that lead to mediocre leadership and the damaging consequences that they can have on employees.
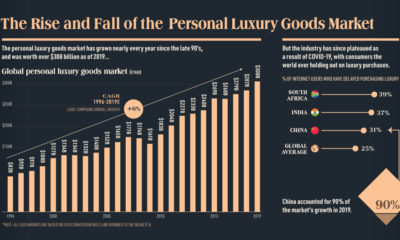

This infographic charts the rise and fall of the $308 billion global personal luxury market, and explores what the coming year holds for its growth
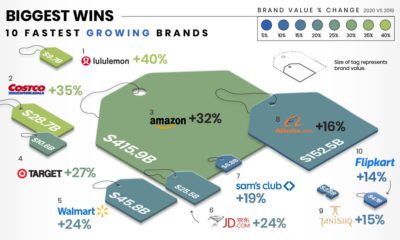

This infographic illustrates how the fastest growing and declining retail brands are attempting to stay relevant in the pandemic economy.
Which apps have been the winners and losers of the COVID-19 lockdown? See how consumer behavior and app popularity has shifted in recent months.
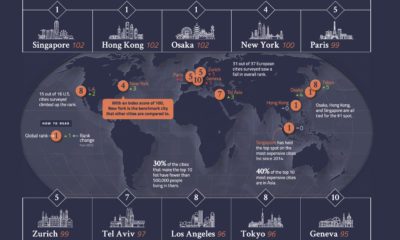

From Osaka to New York, we look at a global ranking of the 10 most expensive cities, and how those rankings have changed over the last...
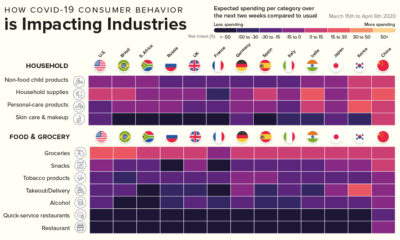

This infographic showcases the industries that will benefit from COVID-19 consumer spending, and the industries that have a very uncertain future.


This infographic explores five key behaviors that CEOs and executives should adopt in order to demonstrate leadership accountability in times of crisis.
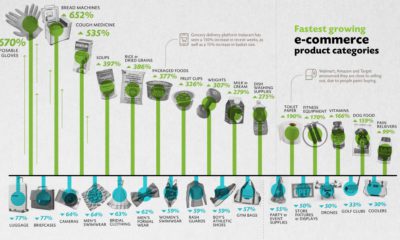

We visualize the ecommerce categories that have experienced the fastest growth, and the categories that are in decline during the COVID-19 pandemic.
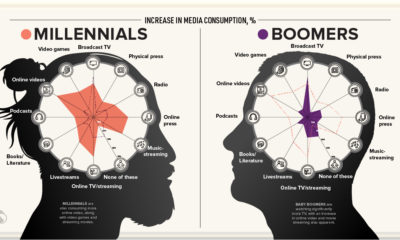

This visualization explores how each generation's media consumption is changing amid the frenzy of pandemic-induced quarantines.
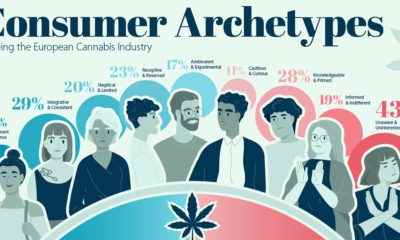

This infographic visualizes the non-consumer and consumer archetypes that could be position Europe as the leader in global cannabis consumption.


While the broader cannabis market is estimated to reach $45B by 2024, we've only scratched the surface in harnessing the potential of minor cannabinoids.
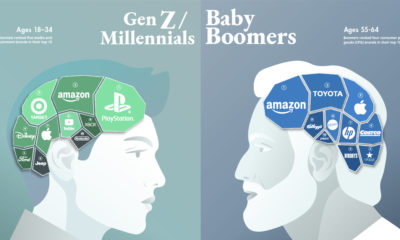

Can a brand transcend time and be all things to all people? This graphic seeks to find out by visualizing the most loved brands by generation.
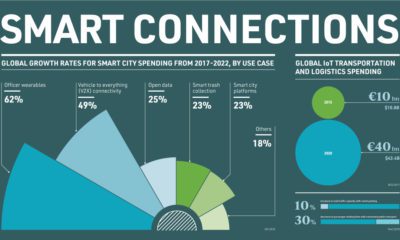

Spending on smart cities is ramping up, and it's being driven by the development and implementation of new IoT technologies.


From artificial intelligence to chatbots, this infographic visualizes what the future of education could look like. Can schools keep up with the times?
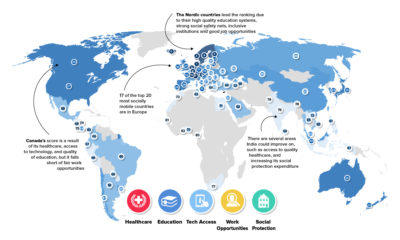

Ranked: The Social Mobility of 82 Countries It’s an unfortunate truth that a person’s opportunities can be partially tethered to their socioeconomic status at birth. Although...
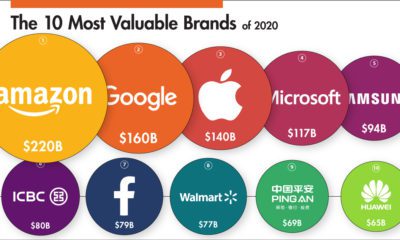

This infographic ranks some of the world’s biggest companies by brand value in 2020 and visualizes the movers and shakers over the past year.