COVID-19
Measuring the Emotional Impact of COVID-19 on the U.S. Population


The Emotional Impact of COVID-19 on the U.S. Population
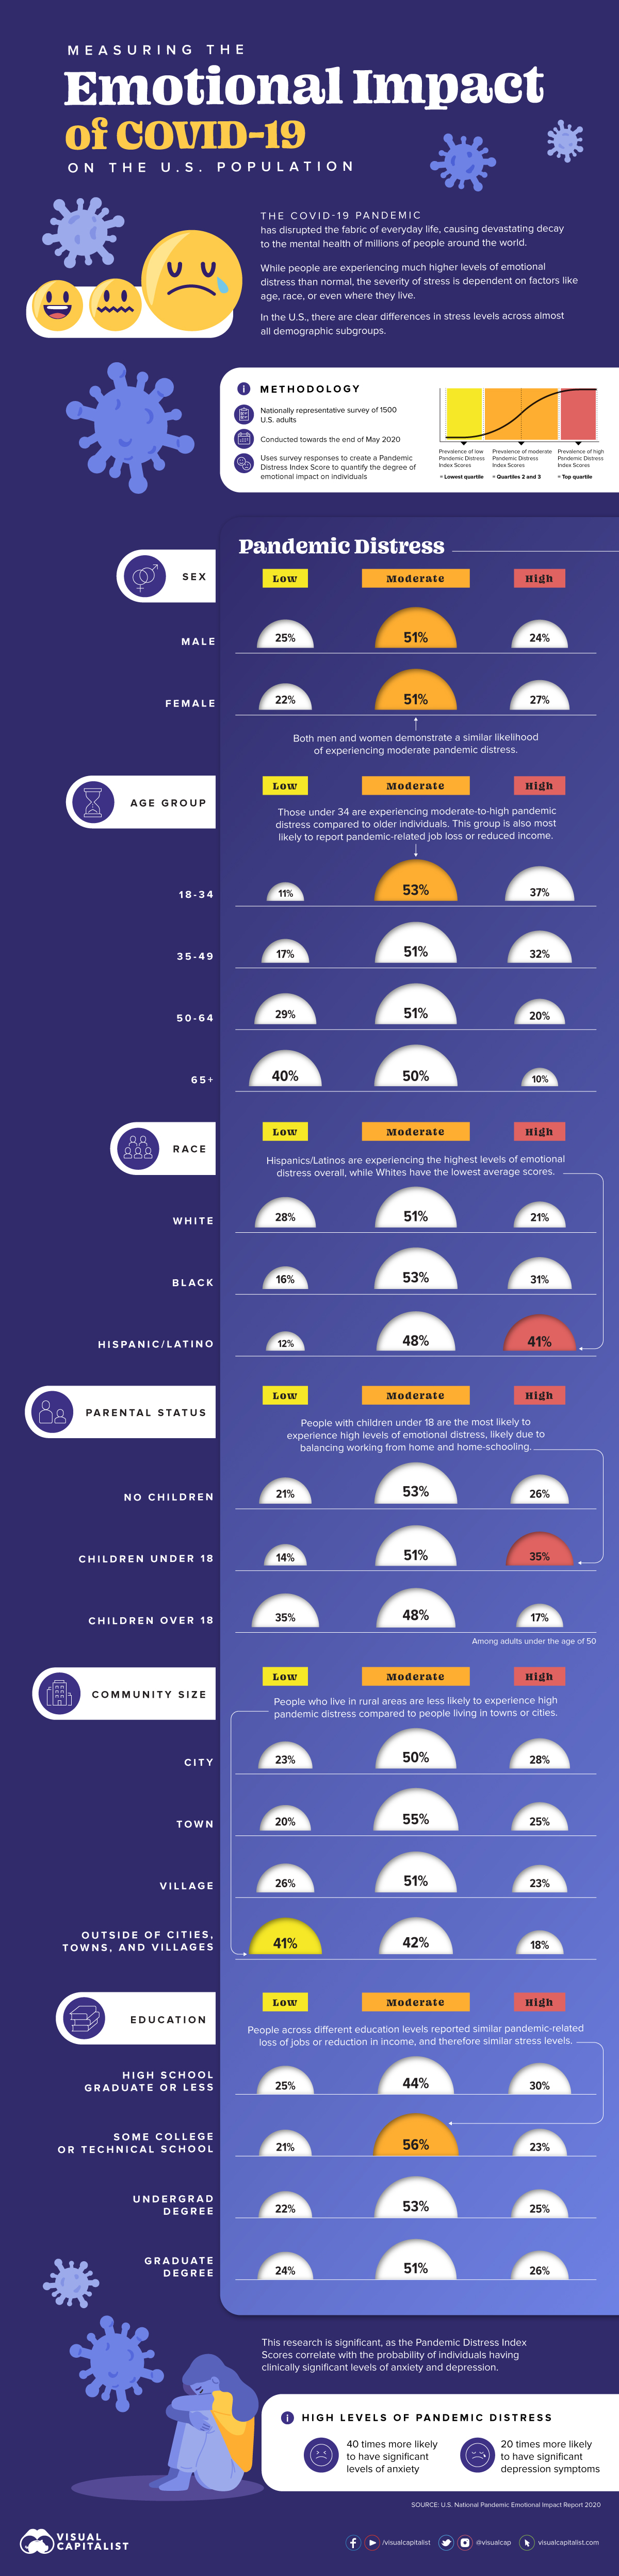
The COVID-19 pandemic has ripped through almost every country on the planet, causing devastating decay to the mental health of millions of people.
While most of us are experiencing higher levels of emotional distress than normal, the severity of stress may change based on factors such as age, race, education level, or even where you live.
This graphic uses data from the National Pandemic Emotional Impact Report to illustrate how each demographic subgroup in the U.S. is feeling.
The Methodology
The emotional upheaval of such a unique event impacts people in different ways, and is difficult to measure given the many direct and indirect factors associated with it.
For the report referenced in the graphic, researchers created a detailed methodology to measure the impact of COVID-19 across a sample of 1,500 adults. Surveys were conducted in May 2020, when the majority of people were under strict lockdown orders. Unemployment levels mirrored those seen only during the Great Depression, and of course, the death rate was rising quicker than anyone could have anticipated.
A Pandemic Distress Index Score (PDIS) was calculated based on participant’s responses, which were then divided into low (bottom 25%), moderate, and high (top 25%) quartiles of pandemic distress.
Emotional Distress Levels, by Demographic Group
Findings uncovered that almost 40% of participants have lost their jobs, or experienced a reduction in income due to the COVID-19 outbreak. However, the reverberations of such stressors vary by demographic subgroup.
Age
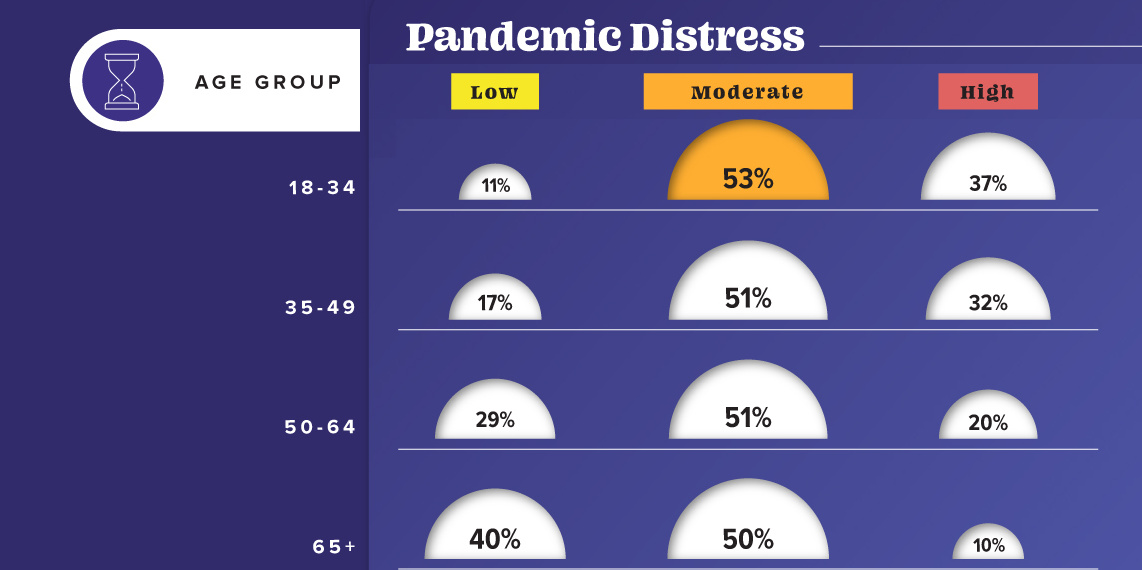
According to the report, pandemic-related emotional distress decreases by age group. People in the 18-34 year bracket reported the most pandemic-related distress overall—with respondents citing high stress at nearly double the rate of people over 50 years old. Meanwhile, respondents in the 65+ age group had reported the lowest distress scores of all.
Race
Of all ethnicities in the survey, Hispanics/Latinos and Blacks had the highest average Pandemic Distress Index Scores, and Whites had the lowest average scores.
It is also worth noting that the research concluded five days after the death of George Floyd, so the majority of responses may not include the influence of this event, and the subsequent movement against systematic racism.
Other Categories
In other subgroups, there were slight differences worth mentioning. For example, from a communities perspective, people who live in rural areas were less likely to experience high pandemic distress compared to people living in towns or cities.
When it comes to the battle of the sexes, men and women experience similar levels of distress. Moreover, the level of emotional distress related to COVID-19 did not differ much between people with children under 18 and those with older children. However, women with children under 18 reported more symptoms of anxiety compared to women with no minor children.
What Does the Data Mean?
While the research presents several important insights, understanding what it means is crucial in providing people with the support they need.
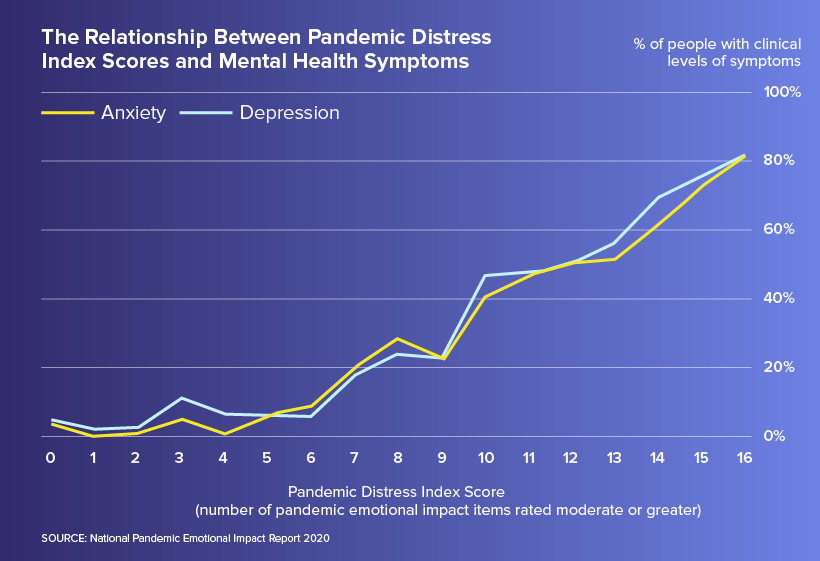
For example, participants with high pandemic-related distress are 40 times more likely to have clinically significant levels of anxiety and 20 times more likely to have clinically significant symptoms of depression, compared to those on the lower end of the spectrum.
In fact, a report from the Center for Disease Control and Prevention shows that 1 in 4 people in the 18-24 age bracket have seriously considered committing suicide at some point during the month of June 2020, which is in line with the emotional distress scores for this age group.
Building Immunity
While nobody can escape the devastating impacts of COVID-19 on mental health, it is clear that some people are more at risk than others.
Unfortunately, younger adults and people of racial and ethnic minorities have carried higher psychological burdens from the pandemic so far, and we have yet to see the long-term effects that could transpire as a result.
“Even when the pandemic is brought under control, grief, anxiety and depression will continue to affect people and communities.”
—António Guterres, United Nations
Although at times the pandemic may feel inescapable, we must continue to prioritize both our physical and mental health—so we can build immunity for what’s to come.


Healthcare
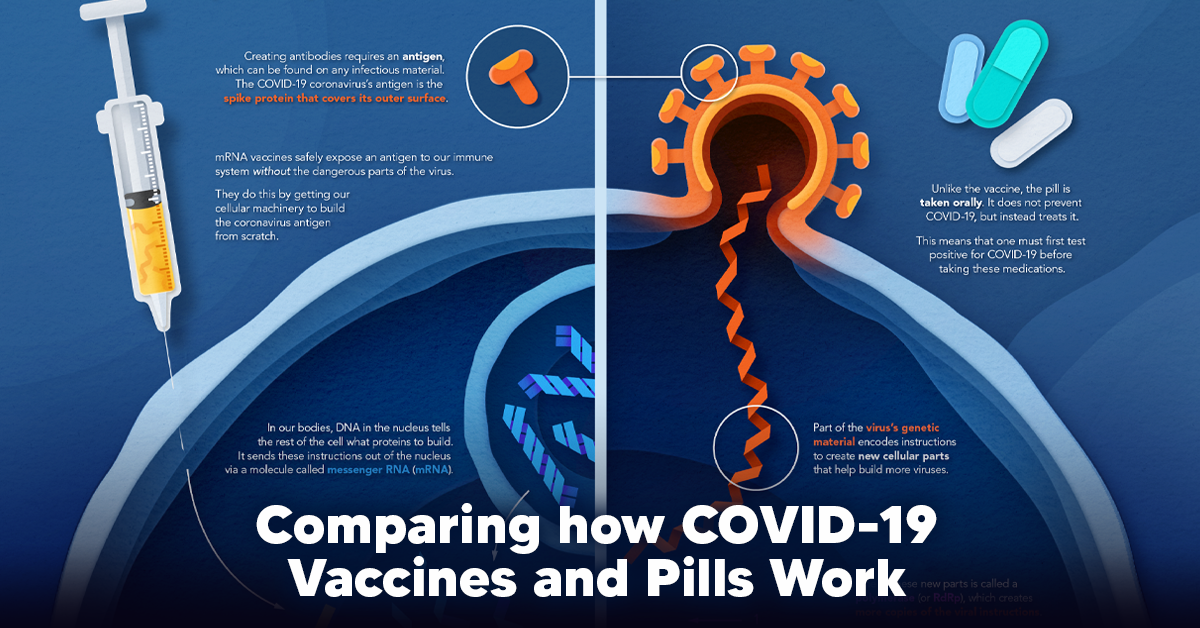
Visualizing How COVID-19 Antiviral Pills and Vaccines Work at the Cellular Level
Despite tackling the same disease, vaccines and antiviral pills work differently to combat COVID-19. We visualize how they work in the body.
Current Strategies to Tackle COVID-19
Since the pandemic started in 2020, a number of therapies have been developed to combat COVID-19.
The leading options for preventing infection include social distancing, mask-wearing, and vaccination. They are still recommended during the upsurge of the coronavirus’s latest mutation, the Omicron variant.
But in December 2021, The United States Food and Drug Administration (USDA) granted Emergency Use Authorization to two experimental pills for the treatment of new COVID-19 cases.
These medications, one made by Pfizer and the other by Merck & Co., hope to contribute to the fight against the coronavirus and its variants. Alongside vaccinations, they may help to curb extreme cases of COVID-19 by reducing the need for hospitalization.
Despite tackling the same disease, vaccines and pills work differently:
| Vaccines | Pills |
|---|---|
| Taken by injection | Taken by mouth |
| Used for prevention | Used for treatment only |
| Create an enhanced immune system by stimulating antibody production | Disrupt the assembly of new viral particles |
How a Vaccine Helps Prevent COVID-19
The main purpose of a vaccine is to prewarn the body of a potential COVID-19 infection by creating antibodies that target and destroy the coronavirus.
In order to do this, the immune system needs an antigen.
It’s difficult to do this risk-free since all antigens exist directly on a virus. Luckily, vaccines safely expose antigens to our immune systems without the dangerous parts of the virus.
In the case of COVID-19, the coronavirus’s antigen is the spike protein that covers its outer surface. Vaccines inject antigen-building instructions* and use our own cellular machinery to build the coronavirus antigen from scratch.
When exposed to the spike protein, the immune system begins to assemble antigen-specific antibodies. These antibodies wait for the opportunity to attack the real spike protein when a coronavirus enters the body. Since antibodies decrease over time, booster immunizations help to maintain a strong line of defense.
*While different vaccine technologies exist, they all do a similar thing: introduce an antigen and build a stronger immune system.
How COVID Antiviral Pills Work
Antiviral pills, unlike vaccines, are not a preventative strategy. Instead, they treat an infected individual experiencing symptoms from the virus.
Two drugs are now entering the market. Merck & Co.’s Lagevrio®, composed of one molecule, and Pfizer’s Paxlovid®, composed of two.
These medications disrupt specific processes in the viral assembly line to choke the virus’s ability to replicate.
The Mechanism of Molnupiravir
RNA-dependent RNA Polymerase (RdRp) is a cellular component that works similar to a photocopying machine for the virus’s genetic instructions. An infected host cell is forced to produce RdRp, which starts generating more copies of the virus’s RNA.
Molnupiravir, developed by Merck & Co., is a polymerase inhibitor. It inserts itself into the viral instructions that RdRp is copying, jumbling the contents. The RdRp then produces junk.
The Mechanism of Nirmatrelvir + Ritonavir
A replicating virus makes proteins necessary for its survival in a large, clumped mass called a polyprotein. A cellular component called a protease cuts a virus’s polyprotein into smaller, workable pieces.
Pfizer’s antiviral medication is a protease inhibitor made of two pills:
- The first pill, nirmatrelvir, stops protease from cutting viral products into smaller pieces.
- The second pill, ritonavir, protects nirmatrelvir from destruction by the body and allows it to keep working.
With a faulty polymerase or a large, unusable polyprotein, antiviral medications make it difficult for the coronavirus to replicate. If treated early enough, they can lessen the virus’s impact on the body.
The Future of COVID Antiviral Pills and Medications
Antiviral medications seem to have a bright future ahead of them.
COVID-19 antivirals are based on early research done on coronaviruses from the 2002-04 SARS-CoV and the 2012 MERS-CoV outbreaks. Current breakthroughs in this technology may pave the way for better pharmaceuticals in the future.
One half of Pfizer’s medication, ritonavir, currently treats many other viruses including HIV/AIDS.
Gilead Science is currently developing oral derivatives of remdesivir, another polymerase inhibitor currently only offered to inpatients in the United States.
More coronavirus antivirals are currently in the pipeline, offering a glimpse of control on the looming presence of COVID-19.
Author’s Note: The medical information in this article is an information resource only, and is not to be used or relied on for any diagnostic or treatment purposes. Please talk to your doctor before undergoing any treatment for COVID-19. If you become sick and believe you may have symptoms of COVID-19, please follow the CDC guidelines.

-

 Debt1 week ago
How Debt-to-GDP Ratios Have Changed Since 2000
-

 Markets2 weeks ago
Ranked: The World’s Top Flight Routes, by Revenue
-

 Countries2 weeks ago
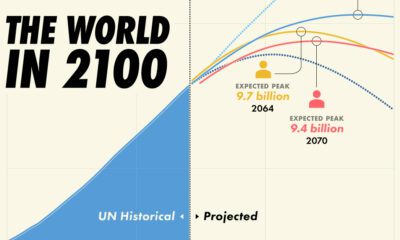
Population Projections: The World’s 6 Largest Countries in 2075
-

 Markets2 weeks ago
The Top 10 States by Real GDP Growth in 2023
-

 Demographics2 weeks ago
The Smallest Gender Wage Gaps in OECD Countries
-

 United States2 weeks ago
Where U.S. Inflation Hit the Hardest in March 2024
-

 Green2 weeks ago
Top Countries By Forest Growth Since 2001
-

 United States2 weeks ago
Ranked: The Largest U.S. Corporations by Number of Employees