

The human gut microbiome contains a world of microbes. We look at the the bacteria that deeply affect our health and well-being.
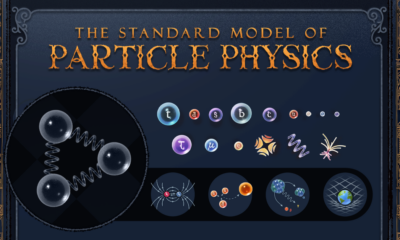

These tiny particles are the building blocks of the entire universe. Explore subatomic particles and how they generate the forces of nature.
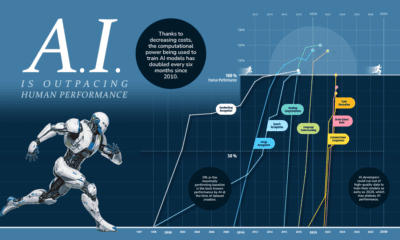

Progress in computation ability, data availability, and algorithm efficiency has led to rapid gains in performance for AI vs humans.
Antarctica's ice extent has reached record lows. This visual details and maps Antarctica sea ice loss over the last two years.


We visualize Earth’s history through the geological timeline to reveal the planet’s many epochs, including the Anthropocene.


The periodic table of elements is widely recognized, but there are hundreds of beautiful and different periodic table reinterpretations.


From single cells to bipedalism, humans have come a long way. Explore the fascinating journey of human evolution in this infographic.
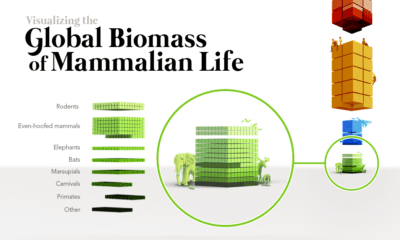

When the world's biomass—the stuff we're made of—is tallied up, humans and cattle outweigh wild mammals by a massive margin.
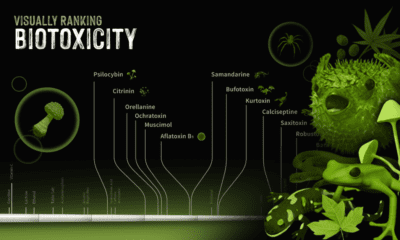

The world can be a poisonous place. We look at a number of different biotoxins found in the natural world and rank their toxicity.


What is the impact of war on science and academia? We examine how nations and the scientific community have responded to the conflict


A train transporting a number of potentially dangerous chemicals derailed near the Ohio–Pennsylvania border. This infographic explains what happened
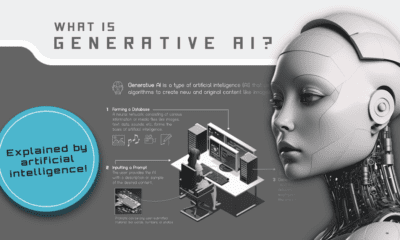

What exactly is generative AI and how does it work? This infographic, created using generative AI tools such as Midjourney and ChatGPT, explains it all.
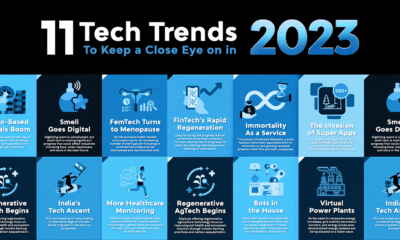

This infographic highlights eleven exciting areas within the world of technology worth keeping an eye on in 2023.
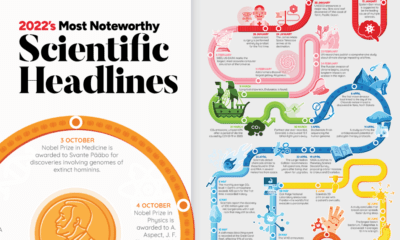

Join us as we look back at some of the most exciting, inspiring, and biggest science stories that made headlines in 2022.
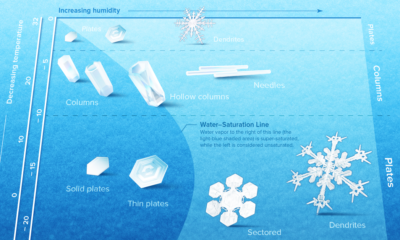

Snowflakes are ice crystals that are beautifully diverse and mysteriously symmetrical. We show what controls their intricate designs.
How recent achievements in nuclear fusion may pave the future for a new form of clean and sustainable energy.
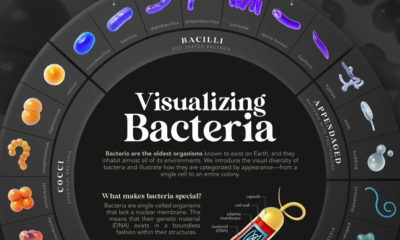

We introduce the visual diversity of bacteria and illustrate how they are categorized by appearance—from a single cell to an entire colony.


How can you tell a fake $100 bill from a real one? In this visual we break down the anatomy and security features of American money.
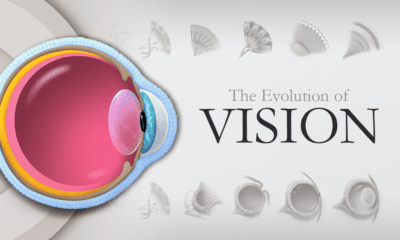

The eye is one of the most complex organs in biology. We illustrate its evolution from a simple photoreceptor cell to a complex structure.
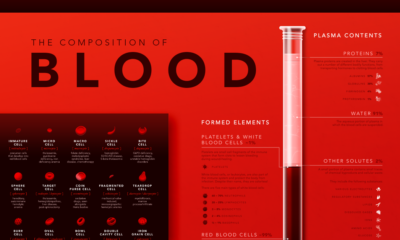

Despite its simple appearance, blood is made up of many microscopic elements. This infographic visualizes the composition of blood.


This new planet-wide animated map, based on a decade of space agency research, shows where water can be found on Mars.
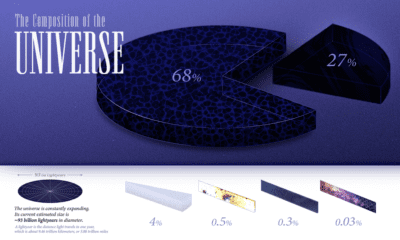

We explore the ultimate frontier: the composition of the entire known universe, some of which are still being investigated today.


More carbon in the atmosphere is creating a hotter world—and gradually fueling both climate change and instances of wildfires.
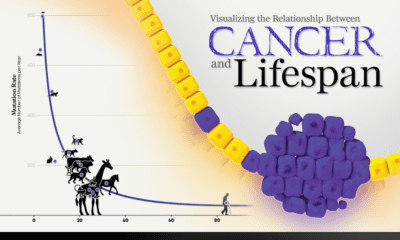

New research links mutation rates and lifespan. We visualize the data supporting this new framework for understanding cancer.
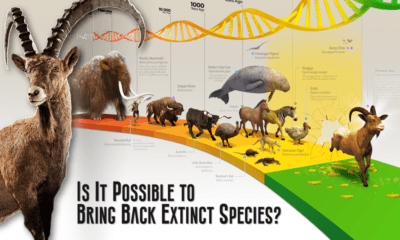

This graphic provides an introduction to de-extinction, a field of biology focused on reviving extinct animal species.
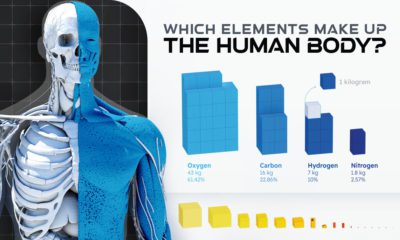

Of the 118 chemical elements found on Earth, only 21 make up the human body. Here we break down the elemental composition of the average human.
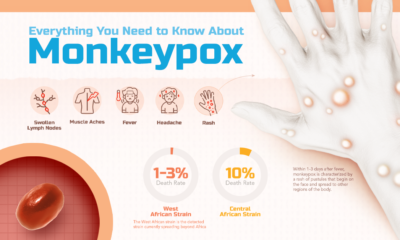

What is monkeypox, and what risk does it pose to the public? This infographic breaks down the symptoms, transmission, and more.
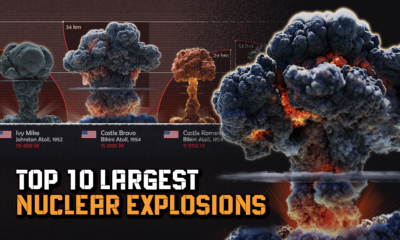

Just how powerful are nuclear bombs? Here's a look at the top 10 largest nuclear explosions.
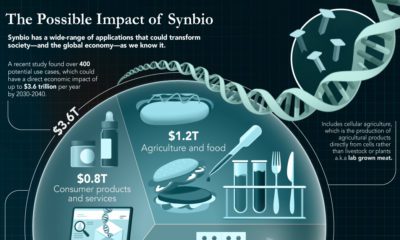

The field of synthetic biology could solve problems in a wide range of industries, from medicine to agriculture—here’s how.
Nuclear weapons have devastating effects, but the science of how they work is atomically small. So, how do nuclear weapons work?
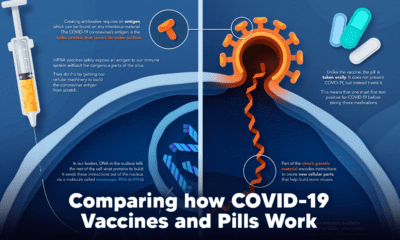

Despite tackling the same disease, vaccines and antiviral pills work differently to combat COVID-19. We visualize how they work in the body.
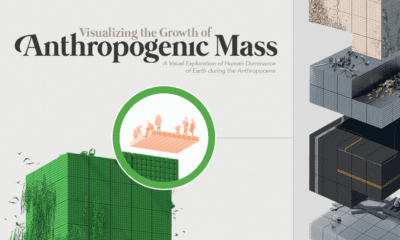

The amount of human-made (or anthropogenic) mass, has now exceeded the weight of all life on Earth, including humans, animals, and plants.
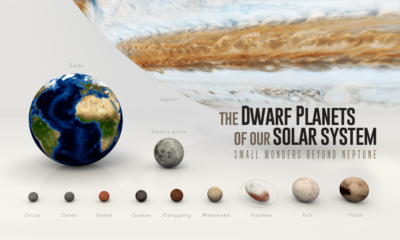

Since dwarf planets started being classified in 2005, nine have been recognized. Here we visually introduce the dwarf planets in our solar system.


Our planet supports nearly 8.7 million species. We break down the total composition of the living world in terms of its biomass.
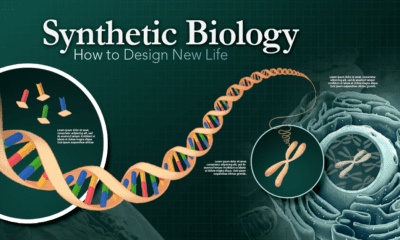

Synthetic biology (SynBio) is a field of science that involves engineering life for human benefit. Here’s an in-depth look at how it works.


