Science
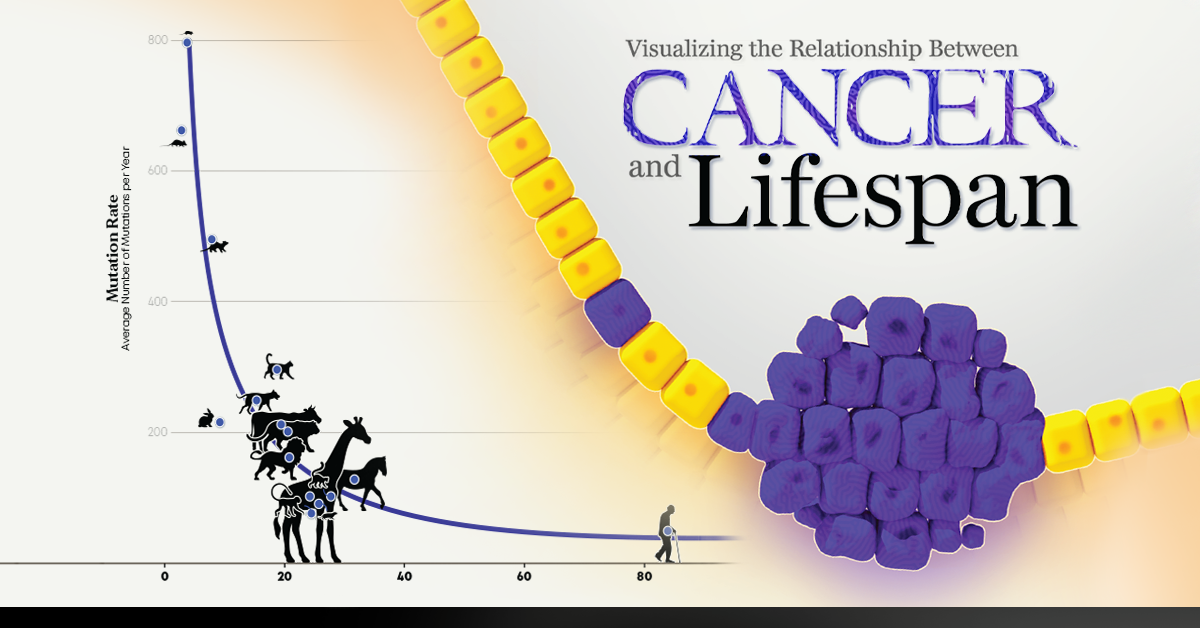
Visualizing the Relationship Between Cancer and Lifespan


A Newfound Link Between Cancer and Aging?
A new study in 2022 reveals a thought-provoking relationship between how long animals live and how quickly their genetic codes mutate.
Cancer is a product of time and mutations, and so researchers investigated its onset and impact within 16 unique mammals. A new perspective on DNA mutation broadens our understanding of aging and cancer development—and how we might be able to control it.
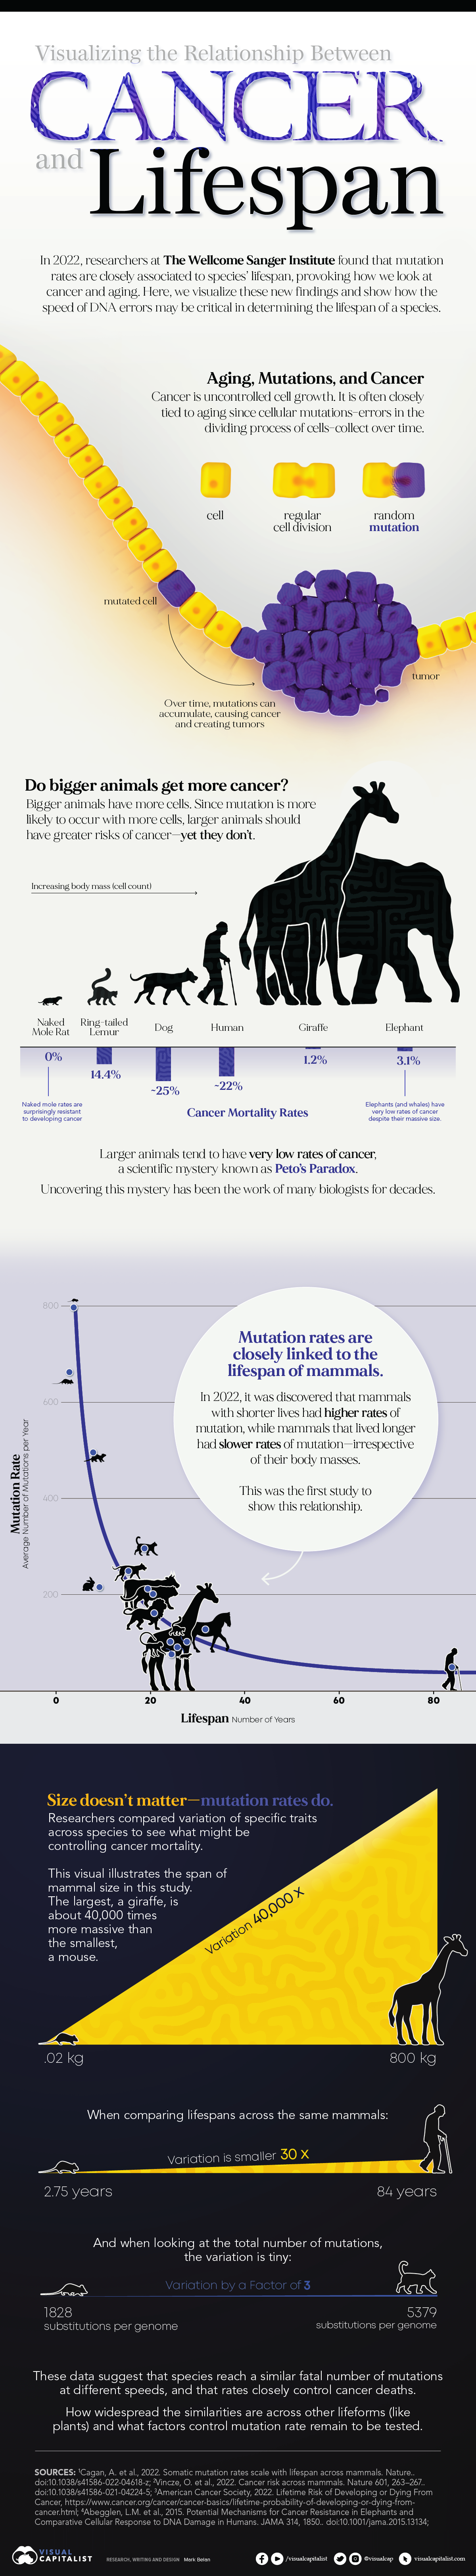
Mutations, Aging, and Cancer: A Primer
Cancer is the uncontrolled growth of cells. It is not a pathogen that infects the body, but a normal body process gone wrong.
Cells divide and multiply in our bodies all the time. Sometimes, during DNA replication, tiny mistakes (called mutations) appear randomly within the genetic code. Our bodies have mechanisms to correct these errors, and for much of our youth we remain strong and healthy as a result of these corrective measures.
However, these protections weaken as we age. Developing cancer becomes more likely as mutations slip past our defenses and continue to multiply. The longer we live, the more mutations we carry, and the likelihood of them manifesting into cancer increases.
A Biological Conundrum
Since mutations can occur randomly, biologists expect larger lifeforms (those with more cells) to have greater chances of developing cancer than smaller lifeforms.
Strangely, no association exists.
It is one of biology’s biggest mysteries as to why massive creatures like whales or elephants rarely seem to experience cancer. This is called Peto’s Paradox. Even stranger: some smaller creatures, like the naked mole rat, are completely resistant to cancer.
This phenomenon motivates researchers to look into the genetics of naked mole rats and whales. And while we’ve discovered that special genetic bonuses (like extra tumor-suppressing genes) benefit these creatures, a pattern for cancer rates across all other species is still poorly understood.
Cancer May Be Closely Associated with Lifespan
Researchers at the Wellcome Sanger Institute report the first study to look at how mutation rates compare with animal lifespans.
Mutation rates are simply the speed at which species beget mutations. Mammals with shorter lifespans have average mutation rates that are very fast. A mouse undergoes nearly 800 mutations in each of its four short years on Earth. Mammals with longer lifespans have average mutation rates that are much slower. In humans (average lifespan of roughly 84 years), it comes to fewer than 50 mutations per year.
The study also compares the number of mutations at time of death with other traits, like body mass and lifespan. For example, a giraffe has roughly 40,000 times more cells than a mouse. Or a human lives 90 times longer than a mouse. What surprised researchers was that the number of mutations at time of death differed only by a factor of three.
Such small differentiation suggests there may be a total number of mutations a species can collect before it dies. Since the mammals reached this number at different speeds, finding ways to control the rate of mutations may help stall cancer development, set back aging, and prolong life.
The Future of Cancer Research
The findings in this study ignite new questions for understanding cancer.
Confirming that mutation rate and lifespan are strongly correlated needs comparison to lifeforms beyond mammals, like fishes, birds, and even plants.
It will also be necessary to understand what factors control mutation rates. The answer to this likely lies within the complexities of DNA. Geneticists and oncologists are continuing to investigate genetic curiosities like tumor-suppressing genes and how they might impact mutation rates.
Aging is likely to be a confluence of many issues, like epigenetic changes or telomere shortening, but if mutations are involved then there may be hopes of slowing genetic damage—or even reversing it.
While just a first step, linking mutation rates to lifespan is a reframing of our understanding of cancer development, and it may open doors to new strategies and therapies for treating cancer or taming the number of health-related concerns that come with aging.


Science
Visualizing the Average Lifespans of Mammals
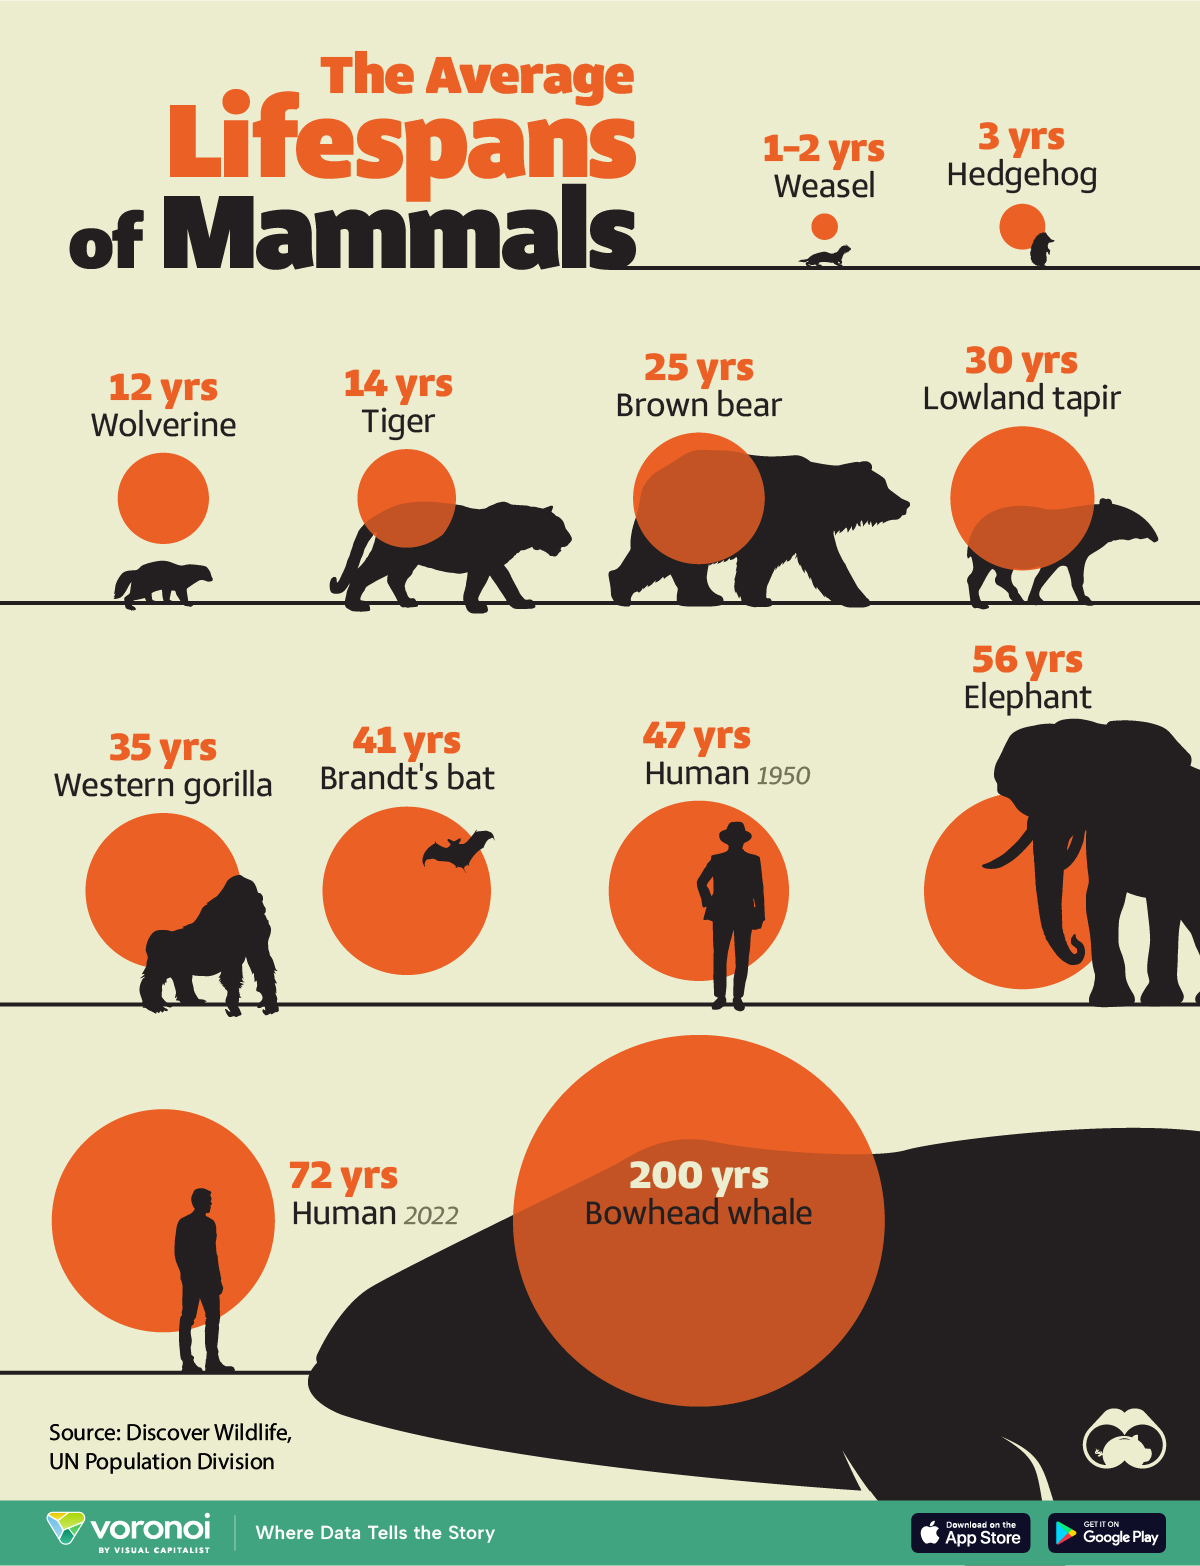
While smaller animals such as weasels typically live 1-2 years, larger counterparts can thrive for decades.
Visualizing the Average Lifespans of Mammals
This was originally posted on our Voronoi app. Download the app for free on iOS or Android and discover incredible data-driven charts from a variety of trusted sources.
Mammals, though comprising a small fraction of Earth’s creatures, hold vital ecological roles globally. They are crucial for maintaining ecosystem health through services like pollination, seed dispersal, and predator-prey dynamics.
In this visualization, we depict the average lifespans of mammals, using data from Discover Wildlife and the United Nations.
Human Lifespans on the Rise
Defined as warm-blooded creatures with hair or fur, mammals nurse their young with milk from mammary glands. While smaller animals such as weasels typically live 1-2 years, larger counterparts like elephants can thrive for decades, and bowhead whales can live for 200 years, or even longer.
| Animal | Average lifespan (years) |
|---|---|
| Weasel | 1 to 2 |
| Hedgehog | 3 |
| Wolverine | 12 |
| Tiger | 14 |
| Brown bear | 25 |
| Lowland tapir | 30 |
| Western gorilla | 35 |
| Brandt's bat | 41 |
| Humans (1950) | 47 |
| Elephant | 56 |
| Humans (2022) | 72 |
| Bowhead whale | 200 |
Notably, human lifespans have experienced a remarkable surge. According to the UN Population Division, the global average life expectancy has surged from 47 years in 1950 to 72 years in 2022, marking a 25-year increase. This is attributed to advancements in nutrition, medication, and essential resources.
However, as human longevity flourishes, it can have an adverse effect on wildlife mammal populations. To put this into numbers, over the past 100,000 years, the surge in human population has precipitated an 85% reduction in wild mammal biomass.
Today, livestock dominates 62% of the world’s mammal biomass, with humans accounting for 34%, while wild mammals comprise only 4%.
Despite a decline in mammal diversity, the total biomass of terrestrial mammals has significantly increased, expanding approximately ninefold over the past 10,000 years.
Curious to learn more about mammals? Check out this graphic that shows the biomass of all the world’s mammals.

-

 Science7 days ago
Visualizing the Average Lifespans of Mammals
-

 Markets2 weeks ago
The Top 10 States by Real GDP Growth in 2023
-

 Demographics2 weeks ago
The Smallest Gender Wage Gaps in OECD Countries
-

 Economy2 weeks ago
Where U.S. Inflation Hit the Hardest in March 2024
-

 Green2 weeks ago
Top Countries By Forest Growth Since 2001
-

 United States2 weeks ago
Ranked: The Largest U.S. Corporations by Number of Employees
-

 Maps2 weeks ago
The Largest Earthquakes in the New York Area (1970-2024)
-

 Green2 weeks ago
Ranked: The Countries With the Most Air Pollution in 2023