Technology
Mapped: The World’s Top 50 Science and Technology Hubs
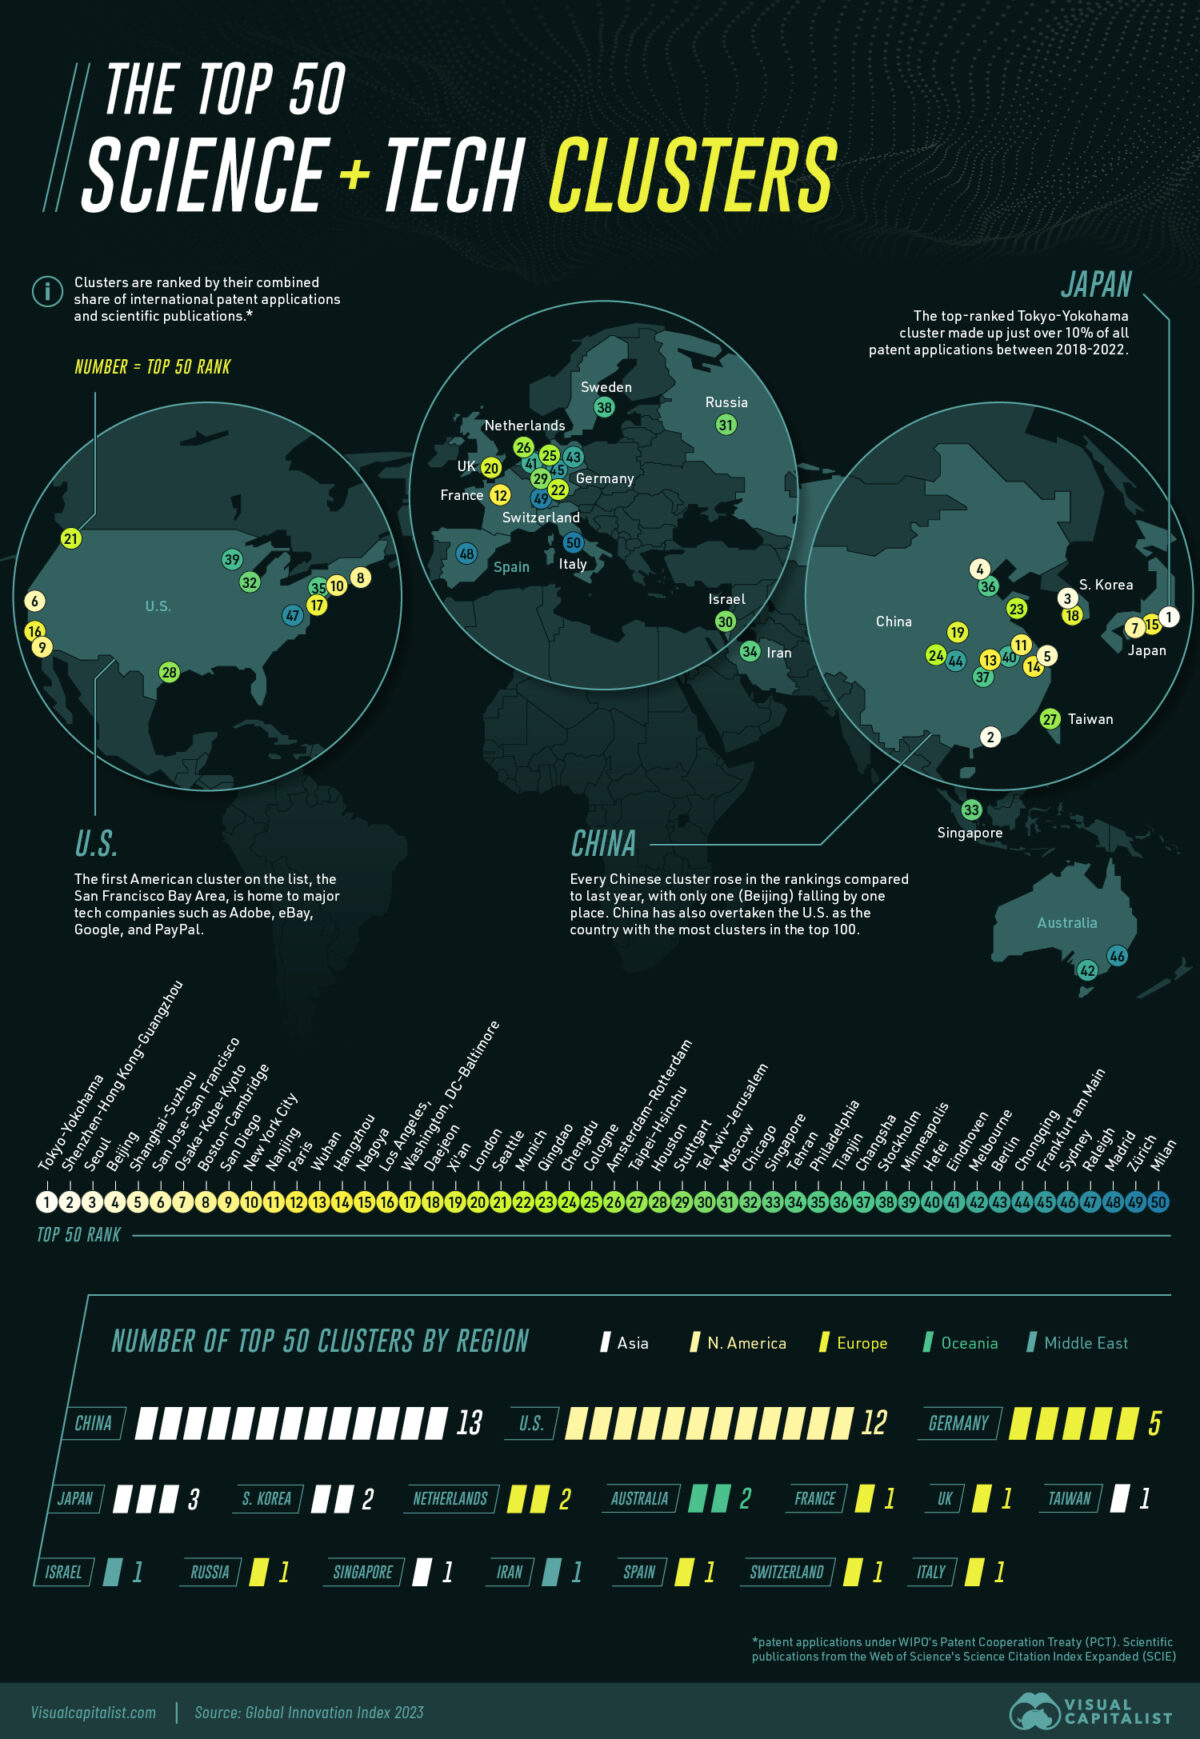
![]() See this visualization first on the Voronoi app.
See this visualization first on the Voronoi app.
The World’s Top 50 Science and Technology Hubs
This was originally posted on our Voronoi app. Download the app for free on iOS or Android and discover incredible data-driven charts from a variety of trusted sources.
In 2023, the world experienced another wave of science and technology (S&T) innovation, from the introduction of the first over-the-counter birth control pill in the U.S. to the stunning growth of ChatGPT and artificial intelligence.
This map explores the world’s top 50 science and technology hubs leading these innovations based on data from the Global Innovation Index 2023. Hubs were ranked by their combined share of international patent applications and scientific publications.
East Asia Dominance in S&T
The world’s five most significant science and technology hubs are in East Asia.
The top-ranked Tokyo-Yokohama cluster made up just over 10% of all patent applications between 2018-2022.
| Cluster | Country/Economy | Patent Applications | Scientific Publications |
|---|---|---|---|
| Tokyo-Yokohama | 🇯🇵 Japan | 127,418 | 115,020 |
| Shenzhen-Hong Kong-Guangzhou | 🇨🇳/🇭🇰 China/Hong Kong | 113,482 | 153,180 |
| Seoul | 🇰🇷 South Korea | 63,447 | 133,604 |
| Beijing | 🇨🇳 China | 38,067 | 279,485 |
| Shanghai-Suzhou | 🇨🇳 China | 32,924 | 162,635 |
| San Jose-San Francisco | 🇺🇸 U.S. | 47,269 | 58,575 |
| Osaka-Kobe-Kyoto | 🇯🇵 Japan | 38,413 | 51,948 |
| Boston-Cambridge | 🇺🇸 U.S. | 18,184 | 76,378 |
| San Diego | 🇺🇸 U.S. | 23,261 | 20,928 |
| New York City | 🇺🇸 U.S. | 13,838 | 74,849 |
| Nanjing | 🇨🇳 China | 7,143 | 113,488 |
| Paris | 🇫🇷 France | 15,176 | 61,692 |
| Wuhan | 🇨🇳 China | 6,250 | 89,756 |
| Hangzhou | 🇨🇳 China | 10,755 | 62,924 |
| Nagoya | 🇯🇵 Japan | 17,736 | 16,091 |
| Los Angeles, | 🇺🇸 U.S. | 11,556 | 44,058 |
| Washington, DC–Baltimore | 🇺🇸 U.S. | 5,525 | 76,039 |
| Daejeon | 🇰🇷 South Korea | 12,275 | 25,552 |
| Xi'an | 🇨🇳 China | 1,786 | 86,937 |
| London | 🇬🇧 Great Britain | 5,981 | 59,068 |
| Seattle | 🇺🇸 U.S. | 11,472 | 20,322 |
| Munich | 🇩🇪 Germany | 10,248 | 24,239 |
| Qingdao | 🇨🇳 China | 7,286 | 39,745 |
| Chengdu | 🇨🇳 China | 2,046 | 67,334 |
| Cologne | 🇩🇪 Germany | 7,466 | 34,286 |
| Amsterdam–Rotterdam | 🇳🇱 Netherlands | 4,230 | 52,864 |
| Taipei–Hsinchu | 🇹🇼 Taiwan | 3,907 | 52,752 |
| Houston | 🇺🇸 U.S. | 8,475 | 24,636 |
| Stuttgart | 🇩🇪 Germany | 9,342 | 14,874 |
| Tel Aviv–Jerusalem | 🇮🇱 Israel | 7,268 | 24,219 |
| Moscow | 🇷🇺 Russia | 2,036 | 55,086 |
| Chicago | 🇺🇸 U.S. | 5,763 | 32,343 |
| Singapore | 🇸🇬/🇲🇾 Singapore/Malaysia | 4,861 | 36,803 |
| Tehran | 🇮🇷 Iran | 249 | 63,113 |
| Philadelphia | 🇺🇸 U.S. | 5,390 | 32,309 |
| Tianjin | 🇨🇳 China | 1,267 | 53,680 |
| Changsha | 🇨🇳 China | 1,149 | 52,768 |
| Stockholm | 🇸🇪 Sweden | 6,069 | 19,984 |
| Minneapolis | 🇺🇸 U.S. | 6,625 | 15,375 |
| Hefei | 🇨🇳 China | 2,549 | 38,974 |
| Eindhoven | 🇳🇱 Netherlands | 7,982 | 5,339 |
| Melbourne | 🇦🇺 Australia | 2,126 | 40,056 |
| Berlin | 🇩🇪 Germany | 3,624 | 30,464 |
| Chongqing | 🇨🇳 China | 1,651 | 41,412 |
| Frankfurt am Main | 🇩🇪 Germany | 5,410 | 18,590 |
| Sydney | 🇦🇺 Australia | 2,539 | 33,695 |
| Raleigh | 🇺🇸 U.S. | 3,057 | 30,206 |
| Madrid | 🇪🇸 Spain | 1,580 | 38,849 |
| Zürich | 🇨🇭 Switzerland | 3,759 | 24,437 |
| Milan | 🇮🇹 Italy | 2,578 | 31,077 |
The first American cluster on the list, the San Francisco Bay Area, is home to major tech companies such as Adobe, eBay, Google, and PayPal.
Along with Cambridge in the United Kingdom, the San Francisco Bay Area is one of the most S&T-intensive clusters relative to overall population density.
For the first time, China topped the list of countries with the highest number of clusters among the top 100, having 24 total. The United States follows, with 21 clusters, then Germany with nine.
In addition, nearly every Chinese cluster rose in the rankings compared to last year, with only Beijing falling by one place.
São Paulo (Brazil); Bengaluru, Delhi, Chennai, and Mumbai (India); Tehran (Islamic Republic of Iran); Istanbul and Ankara (Türkiye); and Moscow (Russian Federation) are the only middle-income economy clusters outside China.
According to the Global Innovation Index, the U.S. leads in research and development (R&D) expenditure, followed by China, Japan, Germany, and the Republic of Korea.


Technology
All of the Grants Given by the U.S. CHIPS Act
Intel, TSMC, and more have received billions in subsidies from the U.S. CHIPS Act in 2024.


All of the Grants Given by the U.S. CHIPS Act
This was originally posted on our Voronoi app. Download the app for free on iOS or Android and discover incredible data-driven charts from a variety of trusted sources.
This visualization shows which companies are receiving grants from the U.S. CHIPS Act, as of April 25, 2024. The CHIPS Act is a federal statute signed into law by President Joe Biden that authorizes $280 billion in new funding to boost domestic research and manufacturing of semiconductors.
The grant amounts visualized in this graphic are intended to accelerate the production of semiconductor fabrication plants (fabs) across the United States.
Data and Company Highlights
The figures we used to create this graphic were collected from a variety of public news sources. The Semiconductor Industry Association (SIA) also maintains a tracker for CHIPS Act recipients, though at the time of writing it does not have the latest details for Micron.
| Company | Federal Grant Amount | Anticipated Investment From Company |
|---|---|---|
| 🇺🇸 Intel | $8,500,000,000 | $100,000,000,000 |
| 🇹🇼 TSMC | $6,600,000,000 | $65,000,000,000 |
| 🇰🇷 Samsung | $6,400,000,000 | $45,000,000,000 |
| 🇺🇸 Micron | $6,100,000,000 | $50,000,000,000 |
| 🇺🇸 GlobalFoundries | $1,500,000,000 | $12,000,000,000 |
| 🇺🇸 Microchip | $162,000,000 | N/A |
| 🇬🇧 BAE Systems | $35,000,000 | N/A |
BAE Systems was not included in the graphic due to size limitations
Intel’s Massive Plans
Intel is receiving the largest share of the pie, with $8.5 billion in grants (plus an additional $11 billion in government loans). This grant accounts for 22% of the CHIPS Act’s total subsidies for chip production.
From Intel’s side, the company is expected to invest $100 billion to construct new fabs in Arizona and Ohio, while modernizing and/or expanding existing fabs in Oregon and New Mexico. Intel could also claim another $25 billion in credits through the U.S. Treasury Department’s Investment Tax Credit.
TSMC Expands its U.S. Presence
TSMC, the world’s largest semiconductor foundry company, is receiving a hefty $6.6 billion to construct a new chip plant with three fabs in Arizona. The Taiwanese chipmaker is expected to invest $65 billion into the project.
The plant’s first fab will be up and running in the first half of 2025, leveraging 4 nm (nanometer) technology. According to TrendForce, the other fabs will produce chips on more advanced 3 nm and 2 nm processes.
The Latest Grant Goes to Micron
Micron, the only U.S.-based manufacturer of memory chips, is set to receive $6.1 billion in grants to support its plans of investing $50 billion through 2030. This investment will be used to construct new fabs in Idaho and New York.

-

 Education1 week ago
How Hard Is It to Get Into an Ivy League School?
-

 Technology2 weeks ago
Ranked: Semiconductor Companies by Industry Revenue Share
-

 Markets2 weeks ago
Ranked: The World’s Top Flight Routes, by Revenue
-

 Demographics2 weeks ago
Population Projections: The World’s 6 Largest Countries in 2075
-

 Markets2 weeks ago
The Top 10 States by Real GDP Growth in 2023
-

 Demographics2 weeks ago
The Smallest Gender Wage Gaps in OECD Countries
-

 Economy2 weeks ago
Where U.S. Inflation Hit the Hardest in March 2024
-

 Environment2 weeks ago
Top Countries By Forest Growth Since 2001