

Intel, TSMC, and more have received billions in subsidies from the U.S. CHIPS Act in 2024.


See which countries have been granted the most AI patents each year, from 2012 to 2022.


We compare America's top 10 companies by revenue in 1994 and 2023 to see how the business landscape has changed.


In this infographic, we map out internet usage by global region based on the latest data from the World Bank.


We visualized the results of an analysis by the World Economic Forum, which uncovered the jobs most impacted by AI.


We visualize the recent performance of the Magnificent Seven stocks, uncovering a clear divergence between the group's top and bottom names.


This graphic illustrates the size of the top 20 Chinese stocks, along with their 1-year return as of March 2024.


This graphic illustrates the biggest stock markets by country, providing a unique breakdown of $110 trillion in valuation.
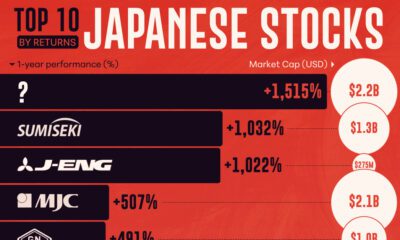

With the Nikkei 225 hitting its first all-time high since 1989, we've ranked the top 10 Japanese stocks by their 1-yr return.
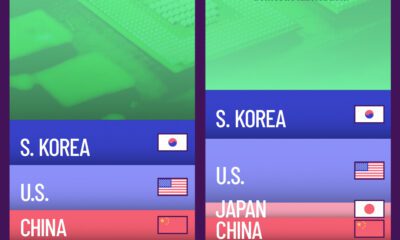

Advanced semiconductors drive technological innovation across various industries. Here, we visualize foundry capacity by country.


