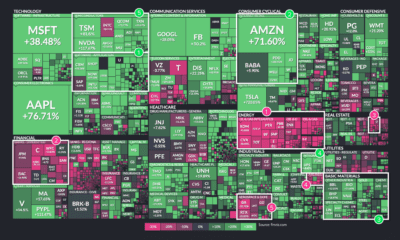

This treemap visualization shows the best and worst performing sectors of the stock market in 2020. We break down the winners and losers.
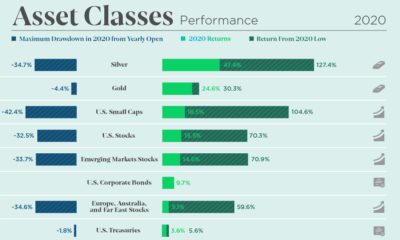

The markets were volatile but offered great opportunity in 2020. See how every asset class, currency, and S&P 500 sector performed over the year.
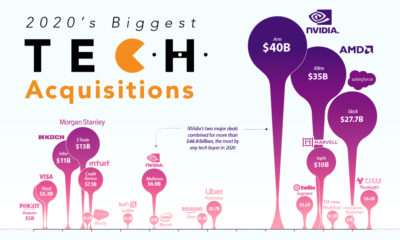

In a challenging year for most, many large tech companies have prospered and grown. We visualize the year’s biggest tech mergers and acquisitions.
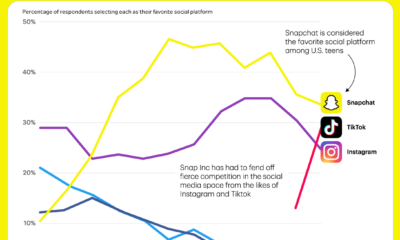

In today's competitive social media landscape, Snapchat is #1 with American teens, but TikTok is quickly closing the gap.
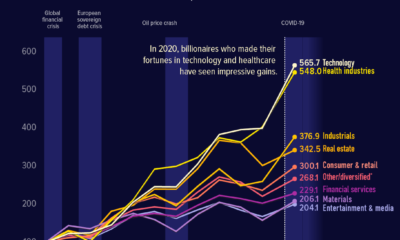

After the coronavirus-related market crash in early 2020, billionaires across every sector saw a double-digit increase in wealth.


By embracing uncertainty and making timely pivots, we visualize the bizarre origin stories of the most successful tech companies today.
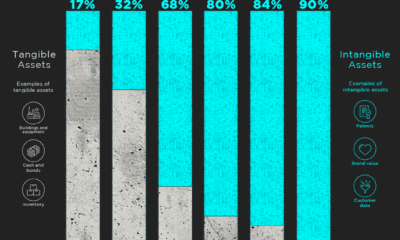

Intangible assets have increased as a portion of total assets in the S&P 500 for 45 years. Today they represent 90% of all assets.


Nearly 6,000 satellites circle our tiny planet. About 60% are space junk, 40% are operational—and hundreds more are launched every year.
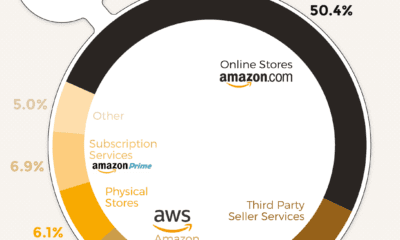

In 2019, Amazon generated $281 billion in total revenue—but where does all this revenue come from? Here’s a breakdown of how Amazon makes its money.


Podcasting is now a billion dollar industry, attracting big names and audiences to match. Here's a global look at the top podcasts on Spotify.


