Environment
The Anthropocene: A New Epoch in the Earth’s History
The Anthropocene: A New Epoch in the Earth’s History
Over the course of Earth’s history, there have been dramatic shifts in the landscape, climate, and biodiversity of the planet. And it is all archived underground.
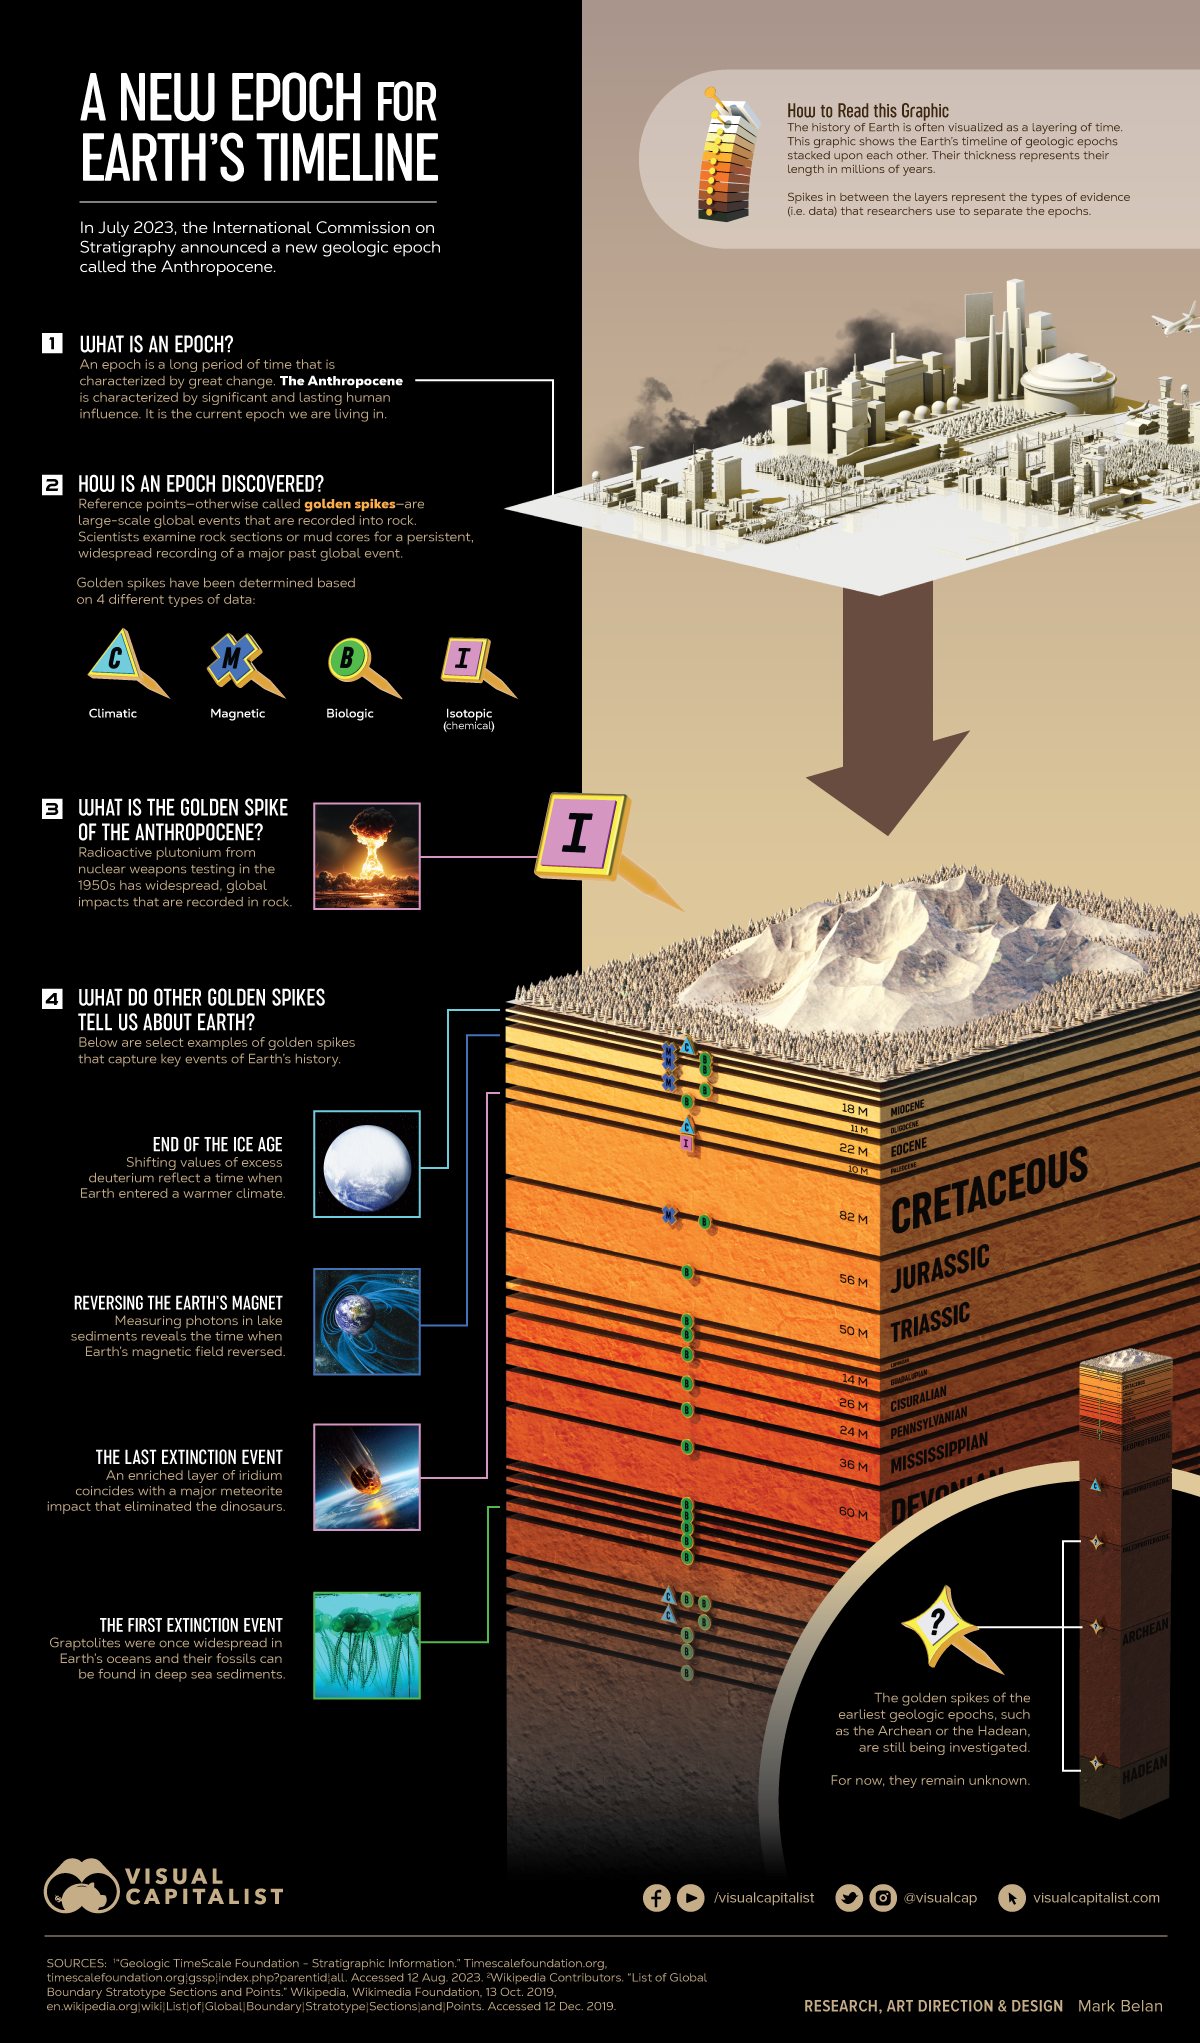
Layers of the planet’s crust carry evidence of pivotal moments that changed the face of the Earth, such as the ice age and asteroid hits. And scientists have recently defined the next major epoch using this geological time scale—the Anthropocene.
In this infographic we dig deep into the Earth’s geological timeline to reveal the planet’s shift from one epoch to another, and the specific events that separate them.
Understanding the Geological Timeline
The Earth’s geological history is divided into many distinct units, from eons to ages. The time span of each varies, since they’re dependent on major events like new species introduction, as well as how they fit into their parent units.
| Geochronologic unit | Time span | Example |
|---|---|---|
| Eon | Several hundred million years to two billion years | Phanerozoic |
| Era | Tens to hundreds of millions of years | Cenozoic |
| Period | Millions of years to tens of millions of years | Quaternary |
| Epoch | Hundreds of thousands of years to tens of millions of years | Holocene |
| Age | Thousands of years to millions of years | Meghalayan |
Note: Subepochs (between epochs and ages) have also been ratified for use in 2022, but are not yet clearly defined.
If we were to cut a mountain in half, we could notice layers representing these changing spans of time, marked by differences in chemical composition and accumulated sediment.
Some boundaries are so distinct and so widespread in the geologic record that they are known as “golden spikes.” Golden spikes can be climatic, magnetic, biological, or isotopic (chemical).
Earth’s Geological Timeline Leading Up to the Anthropocene
The Earth has gone through many epochs leading up to the modern Anthropocene.
These include epochs like the Early Devonian, which saw the dawn of the first early shell organisms 400 million years ago, and the three Jurassic epochs, which saw dinosaurs become the dominant terrestrial vertebrates.
Over the last 11,700 years, we have been living in the Holocene epoch, a relatively stable period that enabled human civilization to flourish. But after millennia of human activity, this epoch is quickly making way for the Anthropocene.
| Epoch | Its start (MYA = Million Years Ago) |
|---|---|
| Anthropocene | 70 Years Ago |
| Holocene | 0.01 MYA |
| Pleistocene | 2.58 MYA |
| Pliocene | 5.33 MYA |
| Miocene | 23.04 MYA |
| Oligocene | 33.90 MYA |
| Eocene | 56.00 MYA |
| Paleocene | 66.00 MYA |
| Cretaceous | 145.0 MYA |
| Jurassic | 201.40 MYA |
| Triassic | 251.90 MYA |
| Lopingian | 259.50 MYA |
| Guadalupian | 273.00 MYA |
| Cisuralian | 300.00 MYA |
| Pennsylvanian | 323.40 MYA |
| Mississippian | 359.30 MYA |
| Devonian | 419.00 MYA |
| Silurian | 422.70 MYA |
| Ludlow | 426.70 MYA |
| Wenlock | 432.90 MYA |
| Llandovery | 443.10 MYA |
| Ordovician | 486.90 MYA |
| Furongian | 497.00 MYA |
| Miaolingian | 521.00 MYA |
| Terreneuvian | 538.80 MYA |
The Anthropocene is distinguished by a myriad of imprints on the Earth including the proliferation of plastic particles and a noticeable increase in carbon dioxide levels in sediments.
A New Chapter in Earth’s History
The clearest identified marker of this geological time shift, and the chosen golden spike for the Anthropocene, is radioactive plutonium from nuclear testing in the 1950s.
The best example has been found in the sediment of Crawford Lake in Ontario, Canada. The lake has two distinct layers of water that never intermix, causing falling sediments to settle in distinct layers at its bed over time.
While the International Commission on Stratigraphy announced the naming of the new epoch in July 2023, Crawford Lake is still in the process of getting approved as the site that marks the new epoch. If selected, our planet will officially enter the Crawfordian Age of the Anthropocene.


Green
Ranked: Top Countries by Total Forest Loss Since 2001
The country with the most forest loss since 2001 lost as much forest cover as the next four countries combined.
Ranked: Top Countries By Total Forest Loss Since 2001
This was originally posted on our Voronoi app. Download the app for free on iOS or Android and discover incredible data-driven charts from a variety of trusted sources.
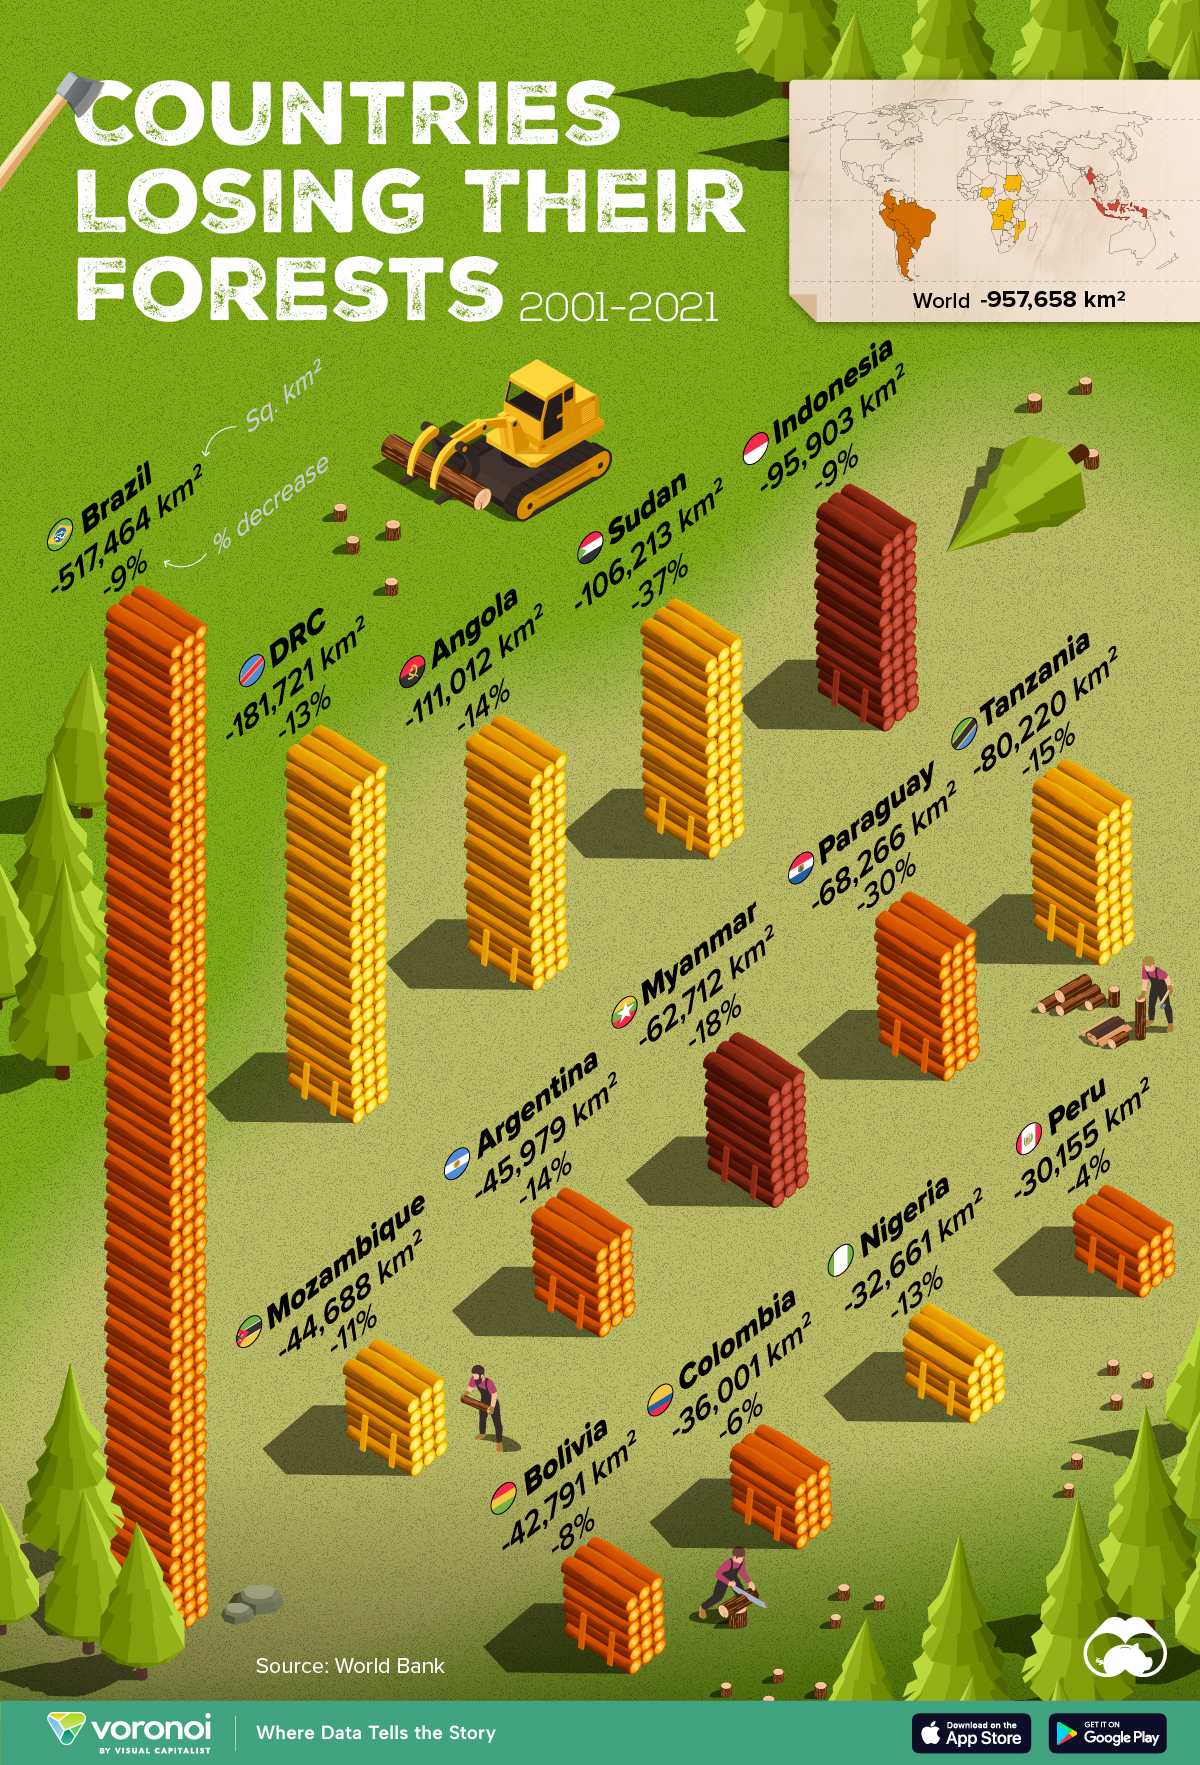
Forests are critical natural resources, often caught in the crosshairs of economic development. Thanks to expanding human settlement, agriculture, and industry, the world lost nearly 1 million square kilometers (km²) of forest cover since 2001.
But where has most of this deforestation occurred?
We rank the countries by the total decrease in their forest area between 2001 and 2021, measured in square kilometers along with their percentage decrease for context. All of this data was sourced from the World Bank.
A caveat to this data: countries are ranked by total forest loss, so countries with the largest forests feature predominantly on this list.
Which Country Has Lost the Most Forests (2001-2021)?
Brazil has lost more than half a million square kilometers of forest in the last two decades. Agricultural expansion for beef and soy production alongside mining and infrastructure growth are the primary drivers behind this large scale deforestation.
This has also caused periodic fires in the Amazon rainforest, drawing repeated alarm from around the world. In fact, Brazil has lost as much forest cover as the next four countries combined.
The table below lists the countries included in this graphic, as well as several others further down the ranking.
| Rank | Country | Region | 2001–21 Change (in km2) | % of Forest Loss |
|---|---|---|---|---|
| 1 | 🇧🇷 Brazil | South America | -517,464 | -9% |
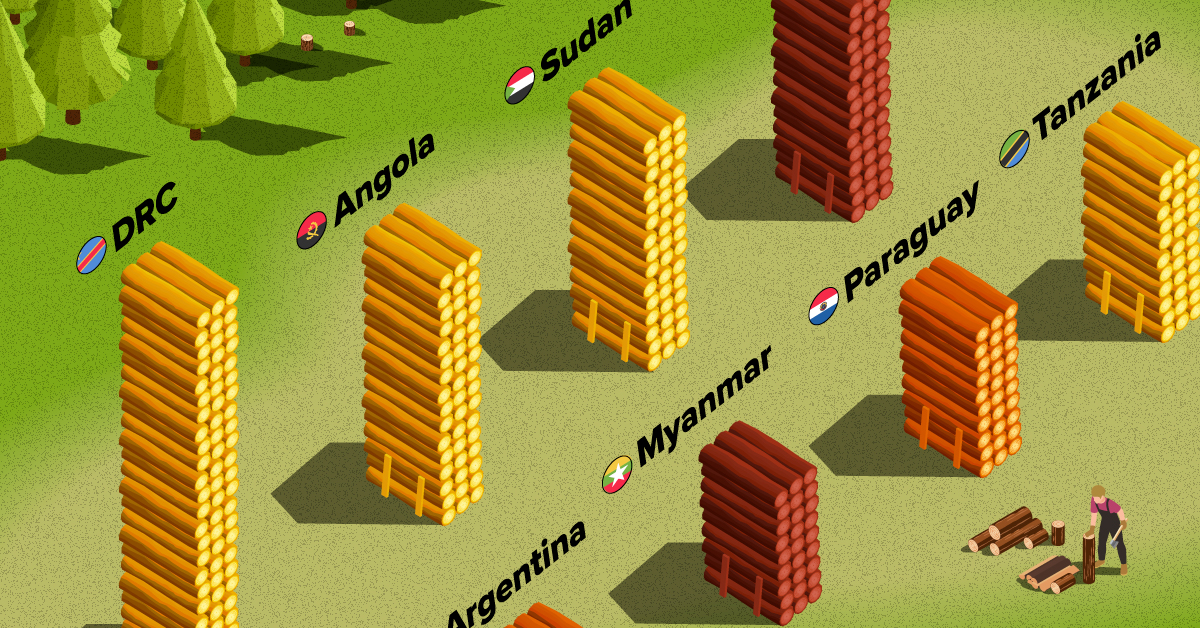
| 2 | 🇨🇩 DRC | Africa | -181,721 | -13% |
| 3 | 🇦🇴 Angola | Africa | -111,012 | -14% |
| 4 | 🇸🇩 Sudan | Africa | -106,213 | -37% |
| 5 | 🇮🇩 Indonesia | Asia | -95,903 | -9% |
| 6 | 🇹🇿 Tanzania | Africa | -80,220 | -15% |
| 7 | 🇵🇾 Paraguay | South America | -68,266 | -30% |
| 8 | 🇲🇲 Myanmar | Asia | -62,712 | -18% |
| 9 | 🇦🇷 Argentina | South America | -45,979 | -14% |
| 10 | 🇲🇿 Mozambique | Africa | -44,688 | -11% |
| 11 | 🇧🇴 Bolivia | South America | -42,791 | -8% |
| 12 | 🇨🇴 Colombia | South America | -36,001 | -6% |
| 13 | 🇳🇬 Nigeria | Africa | -32,661 | -13% |
| 14 | 🇵🇪 Peru | South America | -30,155 | -4% |
| 15 | 🇰🇭 Cambodia | Asia | -28,491 | -26% |
| 16 | 🇻🇪 Venezuela | South America | -28,130 | -6% |
| 17 | 🇲🇽 Mexico | North America | -26,732 | -4% |
| 18 | 🇿🇲 Zambia | Africa | -23,924 | -5% |
| 19 | 🇧🇼 Botswana | Africa | -23,660 | -14% |
| 20 | 🇨🇮 Cote d'Ivoire | Africa | -22,577 | -45% |
What is quickly apparent is how most of the countries on this list are from Africa and South America. A study found a correlation where developing economies tend to have higher deforestation rates than advanced economies. Former colonies have also experienced more forest loss than those that were not colonized.
In Asia, Indonesia’s burgeoning palm oil industry is a key driver to deforestation, though efforts are now being made to reverse its impact. Meanwhile, Cambodia experienced rapid clear-cutting for its growing rubber plantations and timber industry.
Finally, Myanmar has long contended with illegal logging, but the country’s ongoing civil war is styming conversation efforts.

-

 Science1 week ago
Visualizing the Average Lifespans of Mammals
-

 Demographics2 weeks ago
The Smallest Gender Wage Gaps in OECD Countries
-

 United States2 weeks ago
Where U.S. Inflation Hit the Hardest in March 2024
-

 Green2 weeks ago
Top Countries By Forest Growth Since 2001
-

 United States2 weeks ago
Ranked: The Largest U.S. Corporations by Number of Employees
-

 Maps2 weeks ago
The Largest Earthquakes in the New York Area (1970-2024)
-

 Green2 weeks ago
Ranked: The Countries With the Most Air Pollution in 2023
-

 Green2 weeks ago
Ranking the Top 15 Countries by Carbon Tax Revenue