

South Asian nations are the global hotspot for pollution. In this graphic, we rank the world’s most polluted countries according to IQAir.

Despite contributing over half of global GDP, biodiversity is under severe pressure, and key species and ecosystems continue to be lost.
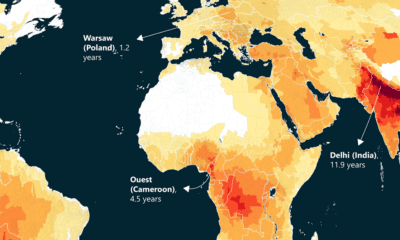

This world map of life expectancy gains shows how much longer people could potentially live by reducing pollution.
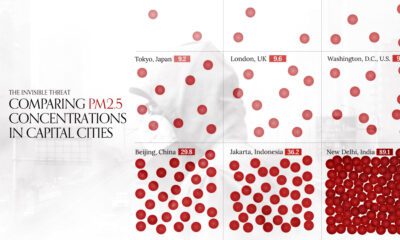

This visual compares air quality in 50 capital cities around the world by average PM2.5 concentrations in 2022.


We visualize Earth’s history through the geological timeline to reveal the planet’s many epochs, including the Anthropocene.


Using 2022 average PM2.5 concentrations, we've ranked the most polluted cities in the world according to IQAir.


How much oil is saved by adding electric vehicles into the mix? We look at data from 2015 to 2025P for different types of EVs.
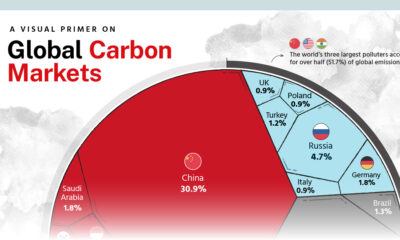

We highlight key findings from the Hinrich Foundation’s latest report on carbon markets, produced in partnership with Visual Capitalist.
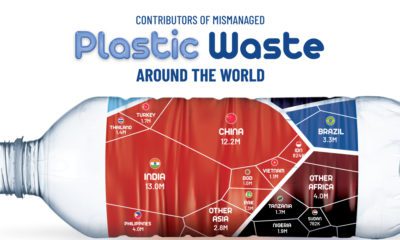

About 22% of the world's annual plastic waste generation is mismanaged. Here's a break down of mismanaged plastic waste by country.
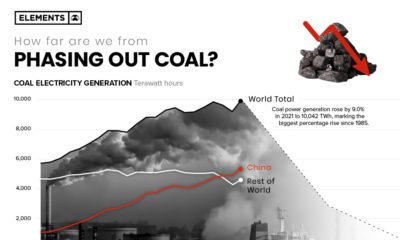

In 2021 coal-fired electricity generation reached all-time highs, rising 9% from the year prior. Here's what it'd take to phase it out of the energy mix.


 Creator Program