Green
Visualizing Mismanaged Plastic Waste by Country


Visualizing Mismanaged Plastic Waste by Country
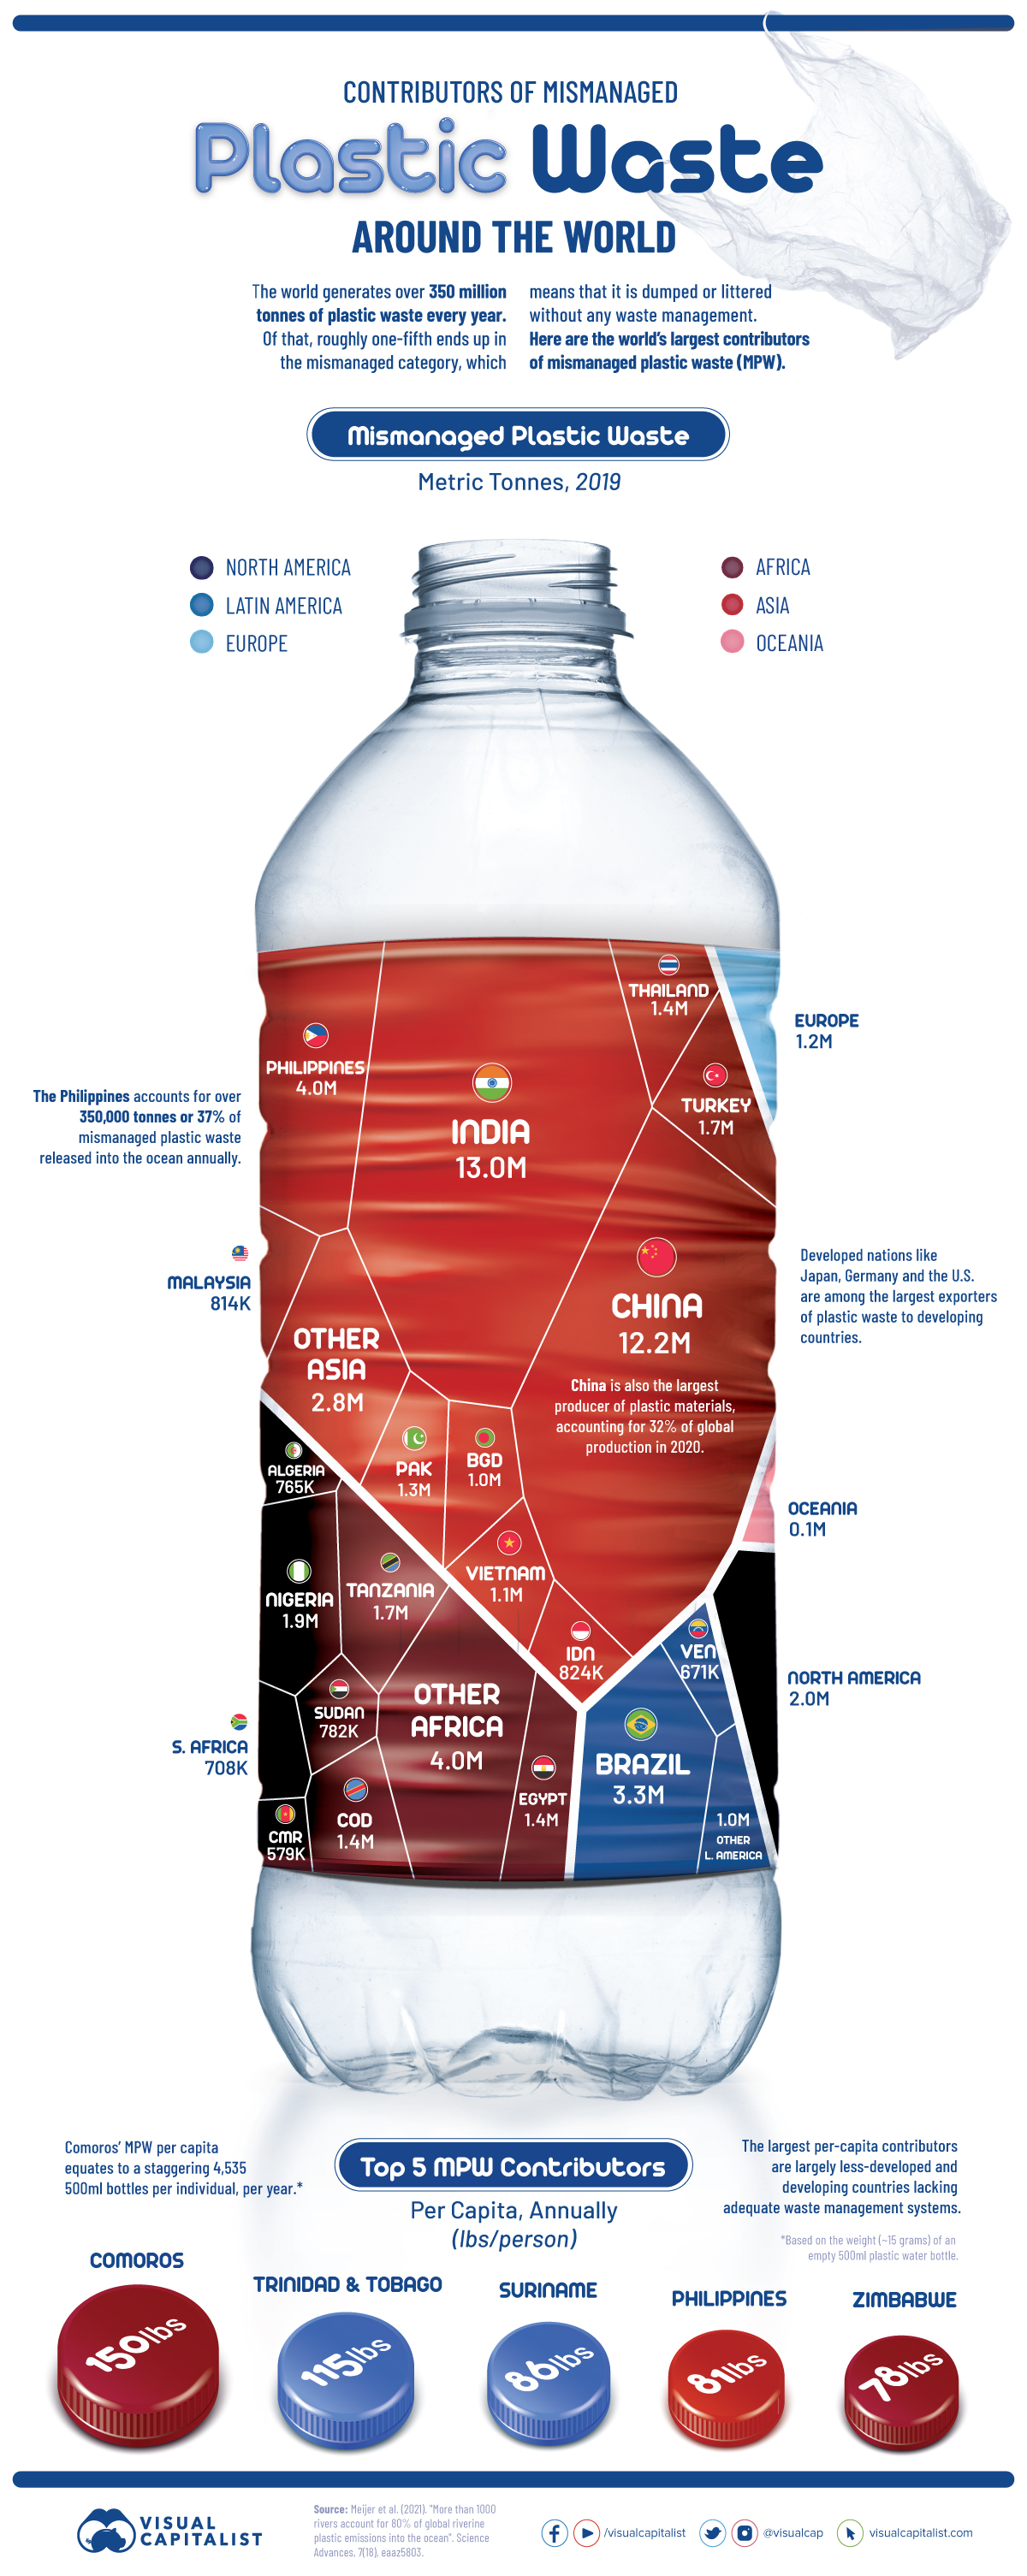
Plastic is one of the most useful materials around, but its proliferating use has created a ballooning heap of plastic waste, with more than 350 million tonnes generated each year.
Only a fraction of plastic waste is recycled, and about one-fifth ends up in the mismanaged category, meaning that it is dumped or littered without proper waste management practices. Mismanaged plastic waste threatens the land and marine environments, and most of it doesn’t decompose, polluting the environment for hundreds of years.
The above infographic visualizes the largest contributors of mismanaged plastic waste in 2019, based on data from a study by Meijer et al. published in the Science Advances journal.
The Largest Contributors of Mismanaged Plastic Waste
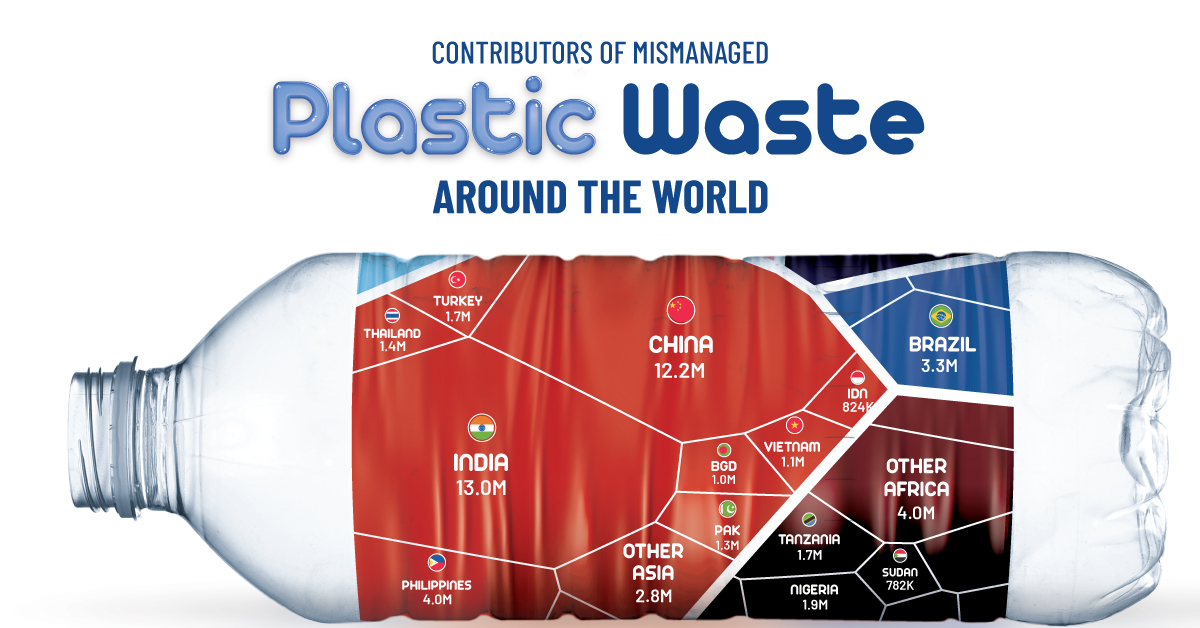
Asian countries account for the majority of global mismanaged plastic waste (MPW), and many of the top plastic-emitting rivers are concentrated in the region.
India and China are the only countries to account for over 10 million tonnes of MPW, although that could partly be driven by their sheer population numbers.
| Country/Region | MPW created in 2019 (tonnes) | % of total |
|---|---|---|
| India 🇮🇳 | 12,994,100 | 21% |
| China 🇨🇳 | 12,272,200 | 20% |
| Philippines 🇵🇭 | 4,025,300 | 7% |
| Brazil 🇧🇷 | 3,296,700 | 5% |
| Nigeria 🇳🇬 | 1,948,950 | 3% |
| North America 🌎 | 1,927,484 | 3% |
| Tanzania 🇹🇿 | 1,716,400 | 3% |
| Turkey 🇹🇷 | 1,656,110 | 3% |
| Egypt 🇪🇬 | 1,435,510 | 2% |
| DR Congo 🇨🇩 | 1,369,730 | 2% |
| Thailand 🇹🇭 | 1,361,690 | 2% |
| Pakistan 🇵🇰 | 1,346,460 | 2% |
| Europe 🌍 | 1,179,881 | 2% |
| Vietnam 🇻🇳 | 1,112,790 | 2% |
| Bangladesh 🇧🇩 | 1,021,990 | 2% |
| Indonesia 🇮🇩 | 824,234 | 1% |
| Malaysia 🇲🇾 | 814,454 | 1% |
| Sudan 🇸🇩 | 781,625 | 1% |
| Algeria 🇩🇿 | 764,578 | 1% |
| South Africa 🇿🇦 | 708,467 | 1% |
| Venezuela 🇻🇪 | 671,431 | 1% |
| Cameroon 🇨🇲 | 578,798 | 1% |
| Oceania 🌎 | 136,506 | 0.2% |
| Other 🗺 | 7,828,312 | 13% |
| Total | 61,773,700 | 100% |
Generally, the top countries in the above table are developing economies that tend to have inadequate waste management infrastructure.
The Philippines is the third-largest contributor and accounts for 37% of all MPW released into the ocean at over 350,000 tonnes per year. Solid waste management remains a major environmental issue in the Philippines. The country recently closed down 335 illegal dumpsites to encourage the use of sanitary landfills and proper waste segregation.
The three continents of North America, Europe, and Oceania together account for just 5% of global mismanaged plastic waste. However, it’s important to note that these figures do not reflect the amount of waste that is exported overseas, and many rich nations are known to export some portions of their waste to poorer nations.
The State of Plastic Waste Trade
In 2019, the Philippines famously shipped back 69 containers of dumped garbage back to Canada, joining other nations in rejecting waste from rich countries.
Until 2017, China was the largest importer of overseas plastic waste, accounting for roughly 50% of global plastic waste imports. Then, it imposed an import ban on almost all types of plastic waste, resulting in a decline in the overall global plastic scrap trade.
In 2021, global plastic waste imports were just over one-third of 2017 levels. However, countries including Malaysia, Indonesia, and Vietnam have been importing more plastic waste since China’s ban, slightly offsetting the impact.
Mismanaged Plastic Waste Per Capita
On a per capita basis, the archipelago of Comoros in East Africa tops the list. Its per capita MPW is equivalent to over 4,500 empty 500ml plastic bottles per person, per year.
| Country | MPW per capita | GDP per capita (2021, current US$) |
|---|---|---|
| Comoros 🇰🇲 | 150lbs (68kg) | $1,495 |
| Trinidad and Tobago 🇹🇹 | 115lbs (52kg) | $15,243 |
| Suriname 🇸🇷 | 86lbs (39kg) | $4,836 |
| Philippines 🇵🇭 | 81lbs (37kg) | $3,549 |
| Zimbabwe 🇿🇼 | 78lbs (35kg) | $1,737 |
While there isn’t much information available on waste management in Comoros, it is one of the world’s least-developed nations. In fact, household consumption accounts for almost 100% of its annual gross domestic product.
Trinidad and Tobago is an outlier due to its high-income status, but a lack of waste segregation among households, alongside inefficient waste management systems, contributes to its high per capita figure.
The Impact of Plastic Waste
Plastic waste has various negative implications for the environment, especially as it can take hundreds of years to decompose.
Millions of tonnes of plastic waste flows into the oceans every year, accounting for at least 85% of all marine garbage. This poses a major threat to aquatic life because fish and other organisms can get entangled in plastic waste and ingest plastics.
On land, plastic waste threatens the quality of the soil and its surrounding ecosystem. Additionally, burning plastic waste releases toxic particles that have a detrimental impact on air quality.
If current trends continue, over 12 billion tonnes of plastic waste is expected to end up in landfills by 2050. Although recycling rates are expected to improve, increasing the availability of adequate waste management systems will be important in preventing plastic waste from entering the environment.


Green
The Carbon Footprint of Major Travel Methods
Going on a cruise ship and flying domestically are the most carbon-intensive travel methods.


The Carbon Footprint of Major Travel Methods
This was originally posted on our Voronoi app. Download the app for free on iOS or Android and discover incredible data-driven charts from a variety of trusted sources.
Did you know that transport accounts for nearly one-quarter of global energy-related carbon dioxide (CO₂) emissions?
This graphic illustrates the carbon footprints of major travel methods measured in grams of carbon dioxide equivalent (CO₂e) emitted per person to travel one kilometer. This includes both CO₂ and other greenhouse gases.
Data is sourced from Our World in Data, the UK Government’s Department for Energy Security and Net Zero, and The International Council on Clean Transportation, as of December 2022.
These figures should be interpreted as approximations, rather than exact numbers. There are many variables at play that determine the actual carbon footprint in any individual case, including vehicle type or model, occupancy, energy mix, and even weather.
Cruise Ships are the Most Carbon-Intensive Travel Method
According to these estimates, taking a cruise ship, flying domestically, and driving alone are some of the most carbon-intensive travel methods.
Cruise ships typically use heavy fuel oil, which is high in carbon content. The average cruise ship weighs between 70,000 to 180,000 metric tons, meaning they require large engines to get moving.
These massive vessels must also generate power for onboard amenities such as lighting, air conditioning, and entertainment systems.
Short-haul flights are also considered carbon-intensive due to the significant amount of fuel consumed during initial takeoff and climbing altitude, relative to a lower amount of cruising.
| Transportation method | CO₂ equivalent emissions per passenger km |
|---|---|
| Cruise Ship | 250 |
| Short-haul flight (i.e. within a U.S. state or European country) | 246 |
| Diesel car | 171 |
| Gas car | 170 |
| Medium-haul flight (i.e. international travel within Europe, or between U.S. states) | 151 |
| Long-haul flight (over 3,700 km, about the distance from LA to NY) | 147 |
| Motorbike | 113 |
| Bus (average) | 96 |
| Plug-in hybrid | 68 |
| Electric car | 47 |
| National rail | 35 |
| Tram | 28 |
| London Underground | 27 |
| Ferry (foot passenger) | 19 |
| Eurostar (International rail) | 4.5 |
Are EVs Greener?
Many experts agree that EVs produce a lower carbon footprint over time versus traditional internal combustion engine (ICE) vehicles.
However, the batteries in electric vehicles charge on the power that comes straight off the electrical grid—which in many places may be powered by fossil fuels. For that reason, the carbon footprint of an EV will depend largely on the blend of electricity sources used for charging.
There are also questions about how energy-intensive it is to build EVs compared to a comparable ICE vehicle.

-

 Science1 week ago
Visualizing the Average Lifespans of Mammals
-

 Markets2 weeks ago
The Top 10 States by Real GDP Growth in 2023
-

 Demographics2 weeks ago
The Smallest Gender Wage Gaps in OECD Countries
-

 United States2 weeks ago
Where U.S. Inflation Hit the Hardest in March 2024
-

 Green2 weeks ago
Top Countries By Forest Growth Since 2001
-

 United States2 weeks ago
Ranked: The Largest U.S. Corporations by Number of Employees
-

 Maps2 weeks ago
The Largest Earthquakes in the New York Area (1970-2024)
-

 Green2 weeks ago
Ranked: The Countries With the Most Air Pollution in 2023