

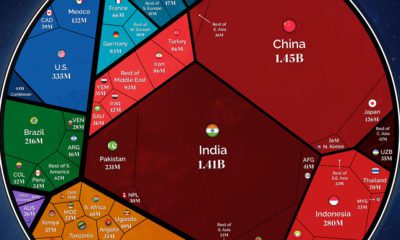
We visualize Asia’s population patterns to see where 4.6 billion people, or two-thirds of the world’s population, actually live.
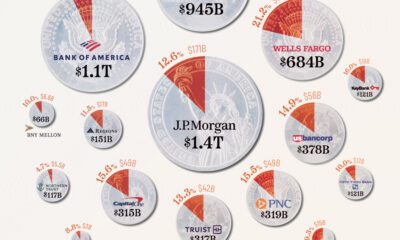

This graphic shows the 20 largest U.S. banks by assets, and their exposure to commercial real estate as a percentage of total loans.


Nearly half a billion people live on the third-largest continent. We take a closer look in this population map of North America.
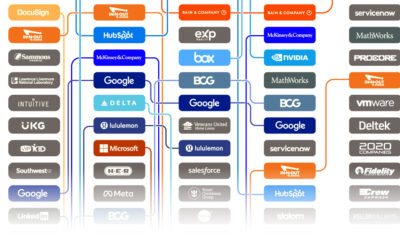

Glassdoor’s annual list is determined by an algorithm that converts reviews to ratings—here are America's 15 best places to work since 2020.


We map out Africa’s population density, spotlighting the continent’s most populous countries and cities.


Of the 44 nations analyzed for retirement welfare, these 25 score well on health, financial, and social support for their aging populations.
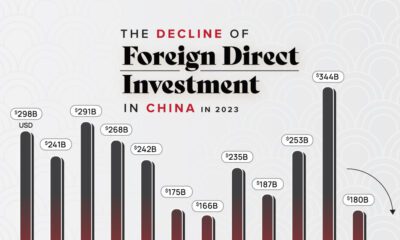

Geopolitical tensions, the closure of due diligence firms, and falling offshore IPOs lead to declining Chinese FDI Inflows.


In this set of three maps, we show the global temperature rise on a national level for 2022, 2050, and 2100 based on an analysis by...
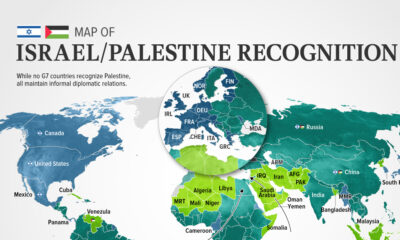

In this visualization, we look at how international recognition of Israel and Palestine breaks down among the 193 UN member states.
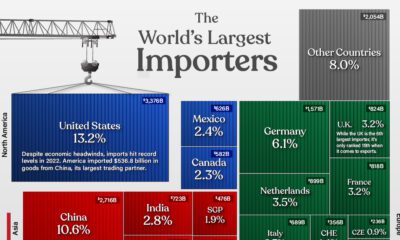

The value of global imports hit $25.6 trillion in 2022. Here are the world's largest import countries, and their share of the global total.
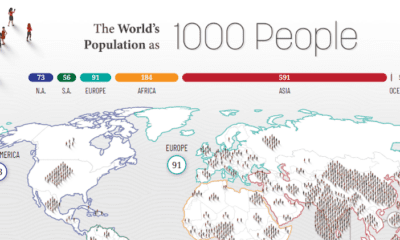

How would all the people in the world be spread out if there were only 1,000 people on Earth? This interactive map examines the breakdown.
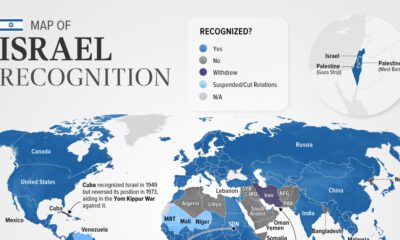

Belize is the latest country to suspend relations with Israel as of November. In this graphic we map the recognition of Israel by country.


Here are the most common investing mistakes to avoid, from emotionally-driven investing to paying too much in fees.


Global wealth stands at over $454 trillion. This graphic shows how it's distributed, by various levels of net worth.


In this graphic, we visualize the destinations that saw the biggest influx of seasonal centi-millionaire residents in 2022.
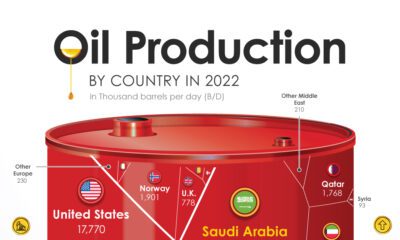

Just three countries—the U.S., Saudi Arabia and Russia—make up the lion’s share of global oil supply. Here are the biggest oil producers in 2022.


Considering factors like the cost of investment and number of locations, this graphic breaks down the best franchises in the U.S.


Empty office space is hitting record highs in 2023. We show almost 1 billion square feet of unused space stacked as a single office tower.
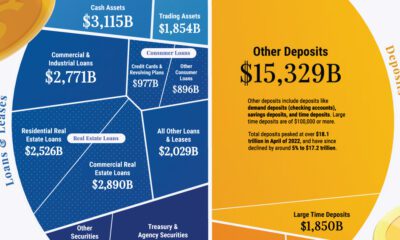

Banks play a crucial role in the U.S. economy, and understanding their balance sheets can offer insight into why they sometimes fail.


While Russia still makes billions from fossil fuel exports, revenues are declining. Here are the largest importers since the start of the invasion.


How much oil, coal, and natural gas do we extract each year? See the scale of annual fossil fuel production in perspective.
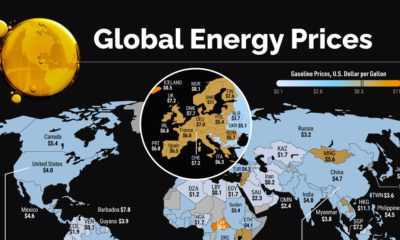

Energy prices have been extremely volatile in 2022. Which countries are seeing the highest prices in the world?
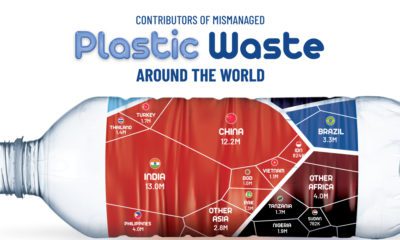

About 22% of the world's annual plastic waste generation is mismanaged. Here's a break down of mismanaged plastic waste by country.


Looking for an EV charging station in the states? This interactive map contains every EV charging station in America.

Our population will soon reach a new milestone—8 billion. These visualizations show where all those people are distributed around the world


Recent floods in Pakistan have affected more than 33 million people. Where is the risk of flooding highest around the world?
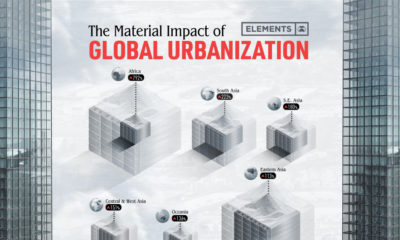

The world’s material consumption is expected to grow from 41 billion tonnes in 2010 to about 89 billion tonnes by 2050. This graphic shows the impact...
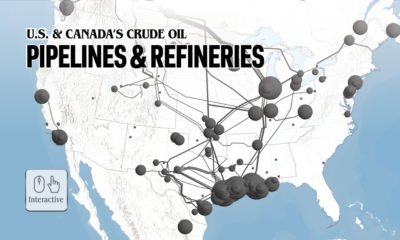

Explore North America's crude oil pipelines and refineries across the U.S. and Canada in our interactive map.


Russia faces a multitude of U.S. sanctions for its participation in global conflicts. This infographic lists who and what has been impacted.
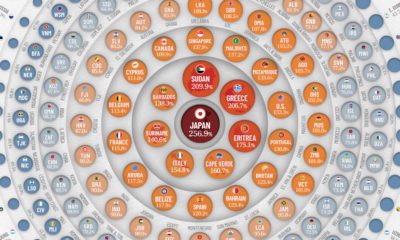

Global debt reached $226T by the end of 2020 – the biggest one-year jump since WWII. This graphic compares the debt-to-GDP ratio of various countries.
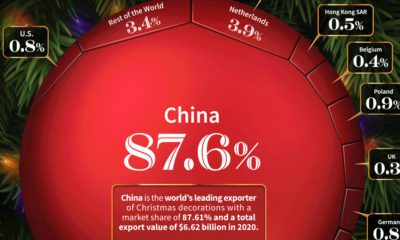

Billions of dollars worth of Christmas decorations are exported around the world each year. Here are the countries that exports the most.
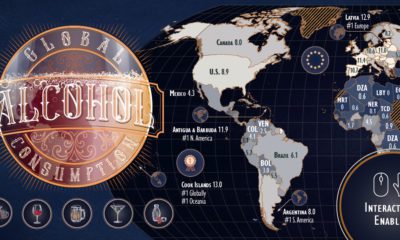

Which countries are the world's biggest alcohol drinkers? This interactive map explores global alcohol consumption per capita.


