Green
Visualizing the Scale of Plastic Bottle Waste Against Major Landmarks
View the original interactive visualization at Reuters Graphics.
Visualizing the Scale of Plastic Bottle Waste
By the time you’re finished reading this sentence, tens of thousands of plastic bottles will have been sold around the world.
The ubiquitous plastic bottle has proven to be a versatile and cost-effective vessel for everything from water to household cleaning products. Despite this undeniable utility, it’s becoming harder to ignore the sheer volume of waste created by the world’s 7.5 billion people.
Today’s data visualization from Simon Scarr and Marco Hernandez at Reuters Graphics puts into perspective the immense scale of plastic bottle waste by comparing it to recognizable global landmarks, and even the entirety of Manhattan.
Plastic Wasted in One Hour

Original image from REUTERS/Simon Scarr, Marco Hernandez.
Every hour, close to 55 million bottles are discarded worldwide. When accumulated, the pile would be higher than the Brazilian Art Deco statue, Christ the Redeemer.
Towering over Rio de Janeiro at 125 feet (38 meters) and with arms outstretched to 98ft (30m), the statue still pales in comparison next to the combined plastic bottle waste over this time period.
Plastic Bottle Waste: Daily and Monthly

Original image from REUTERS/Simon Scarr, Marco Hernandez.
In the span of a day, over 1.3 billion bottles are discarded. If you were to take the elevator up the Eiffel Tower (which has a total height of 1,063ft or 324m), you’d reach the tip of this pile about halfway up.
Fast forward this by a month, however, and it’s a different story. The Eiffel Tower seems like a figurine next to a heap of approximately 40 billion tossed plastic bottles.

Original image from REUTERS/Simon Scarr, Marco Hernandez.
Scaling this up, data from Euromonitor International reveals that over 481 billion plastic bottles are now wasted annually.
Accumulated, this would dwarf even Dubai’s famous Burj Khalifa, the world’s tallest structure at an impressive 2,722ft (830m).
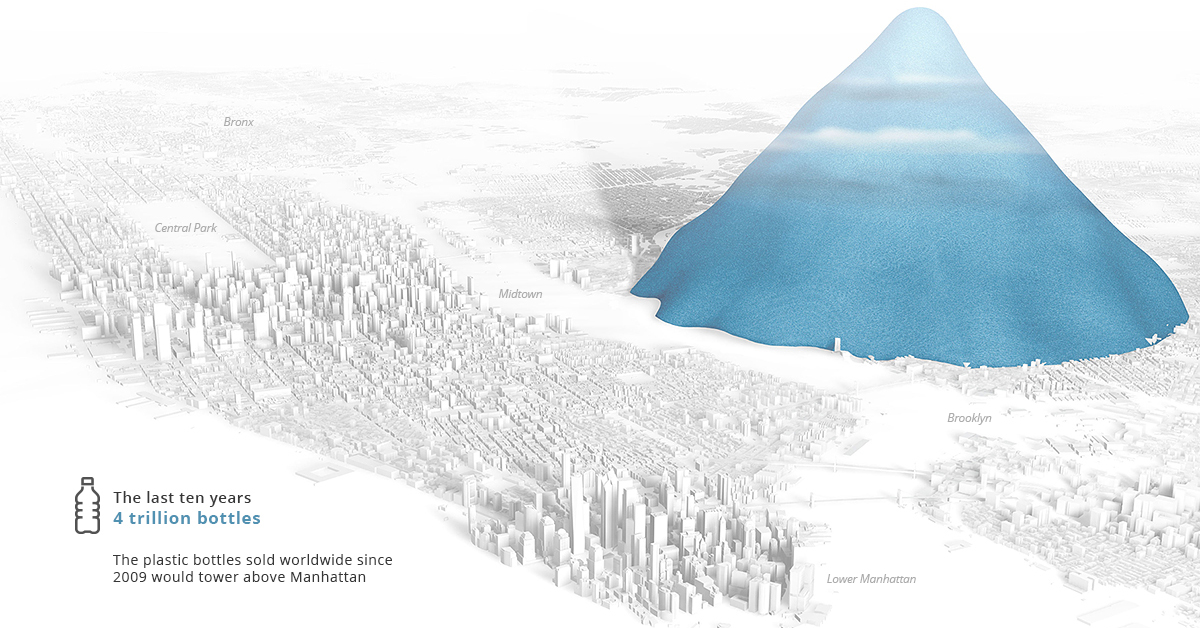
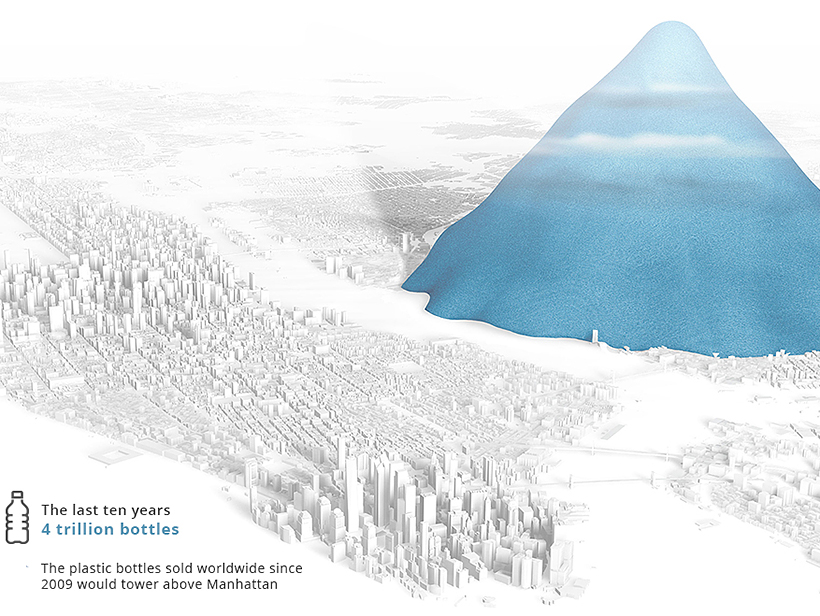
A Decade of Plastic
According to Reuters, nearly 4 trillion bottles were sold in the past ten years, each contributing to a 7,874ft high pile of plastic (2.4km).
Original image from REUTERS/Simon Scarr, Marco Hernandez.
If all plastic bottle waste were piled up in this manner, New Yorkers would see a translucent mountain every time they looked out their window rising to over half the elevation of the tallest peak in the Rocky Mountains, which is 14,440ft (4.4km) high.
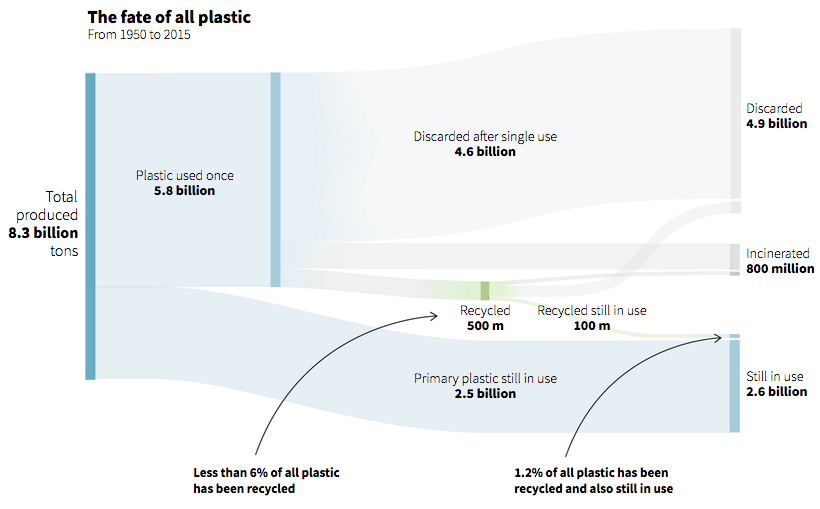
The Global Flow of Plastic Waste Since 1950
Plastic bottles are just the tip of the iceberg for single-use plastics. Other examples include plastic bags, food packaging, coffee cup lids, and straws. As plastic use continues to flourish, even our best attempts at managing waste are falling short.
In fact, only an abysmal 6% of all plastic produced since 1950 has been recycled, with the majority ending up in landfills as litter, or getting incinerated.
Original image from REUTERS/Simon Scarr, Marco Hernandez.
Our plastic use is on an unsustainable trajectory, but countries are taking specific actions to curb use. Canada and the European Union (EU) will ban certain single-use plastics by 2021—and they are among 60 other nations enacting similar policies.
Corporations are also taking steps to reduce impact. A good example of this is Unilever, which made a commitment to make all its packaging reusable, recyclable, or compostable by 2025.


Green
The Carbon Footprint of Major Travel Methods
Going on a cruise ship and flying domestically are the most carbon-intensive travel methods.


The Carbon Footprint of Major Travel Methods
This was originally posted on our Voronoi app. Download the app for free on iOS or Android and discover incredible data-driven charts from a variety of trusted sources.
Did you know that transport accounts for nearly one-quarter of global energy-related carbon dioxide (CO₂) emissions?
This graphic illustrates the carbon footprints of major travel methods measured in grams of carbon dioxide equivalent (CO₂e) emitted per person to travel one kilometer. This includes both CO₂ and other greenhouse gases.
Data is sourced from Our World in Data, the UK Government’s Department for Energy Security and Net Zero, and The International Council on Clean Transportation, as of December 2022.
These figures should be interpreted as approximations, rather than exact numbers. There are many variables at play that determine the actual carbon footprint in any individual case, including vehicle type or model, occupancy, energy mix, and even weather.
Cruise Ships are the Most Carbon-Intensive Travel Method
According to these estimates, taking a cruise ship, flying domestically, and driving alone are some of the most carbon-intensive travel methods.
Cruise ships typically use heavy fuel oil, which is high in carbon content. The average cruise ship weighs between 70,000 to 180,000 metric tons, meaning they require large engines to get moving.
These massive vessels must also generate power for onboard amenities such as lighting, air conditioning, and entertainment systems.
Short-haul flights are also considered carbon-intensive due to the significant amount of fuel consumed during initial takeoff and climbing altitude, relative to a lower amount of cruising.
| Transportation method | CO₂ equivalent emissions per passenger km |
|---|---|
| Cruise Ship | 250 |
| Short-haul flight (i.e. within a U.S. state or European country) | 246 |
| Diesel car | 171 |
| Gas car | 170 |
| Medium-haul flight (i.e. international travel within Europe, or between U.S. states) | 151 |
| Long-haul flight (over 3,700 km, about the distance from LA to NY) | 147 |
| Motorbike | 113 |
| Bus (average) | 96 |
| Plug-in hybrid | 68 |
| Electric car | 47 |
| National rail | 35 |
| Tram | 28 |
| London Underground | 27 |
| Ferry (foot passenger) | 19 |
| Eurostar (International rail) | 4.5 |
Are EVs Greener?
Many experts agree that EVs produce a lower carbon footprint over time versus traditional internal combustion engine (ICE) vehicles.
However, the batteries in electric vehicles charge on the power that comes straight off the electrical grid—which in many places may be powered by fossil fuels. For that reason, the carbon footprint of an EV will depend largely on the blend of electricity sources used for charging.
There are also questions about how energy-intensive it is to build EVs compared to a comparable ICE vehicle.

-

 Education1 week ago
How Hard Is It to Get Into an Ivy League School?
-

 Technology2 weeks ago
Ranked: Semiconductor Companies by Industry Revenue Share
-

 Markets2 weeks ago
Ranked: The World’s Top Flight Routes, by Revenue
-

 Demographics2 weeks ago
Population Projections: The World’s 6 Largest Countries in 2075
-

 Markets2 weeks ago
The Top 10 States by Real GDP Growth in 2023
-

 Demographics2 weeks ago
The Smallest Gender Wage Gaps in OECD Countries
-

 Economy2 weeks ago
Where U.S. Inflation Hit the Hardest in March 2024
-

 Green2 weeks ago
Top Countries By Forest Growth Since 2001