Energy
Ranked: Countries with the Most Sustainable Energy Policies
Ranked: Countries With Most Sustainable Energy Policies
The sourcing and distribution of energy is one of the most pressing issues of our time.
Just under one billion people still lack basic access to electricity, and many more connect to the grid through improvised wiring or live through frequent blackouts. On the flip side of the socioeconomic spectrum, a growing chorus of voices is pressuring governments and corporations to power the global economy in a more sustainable way.
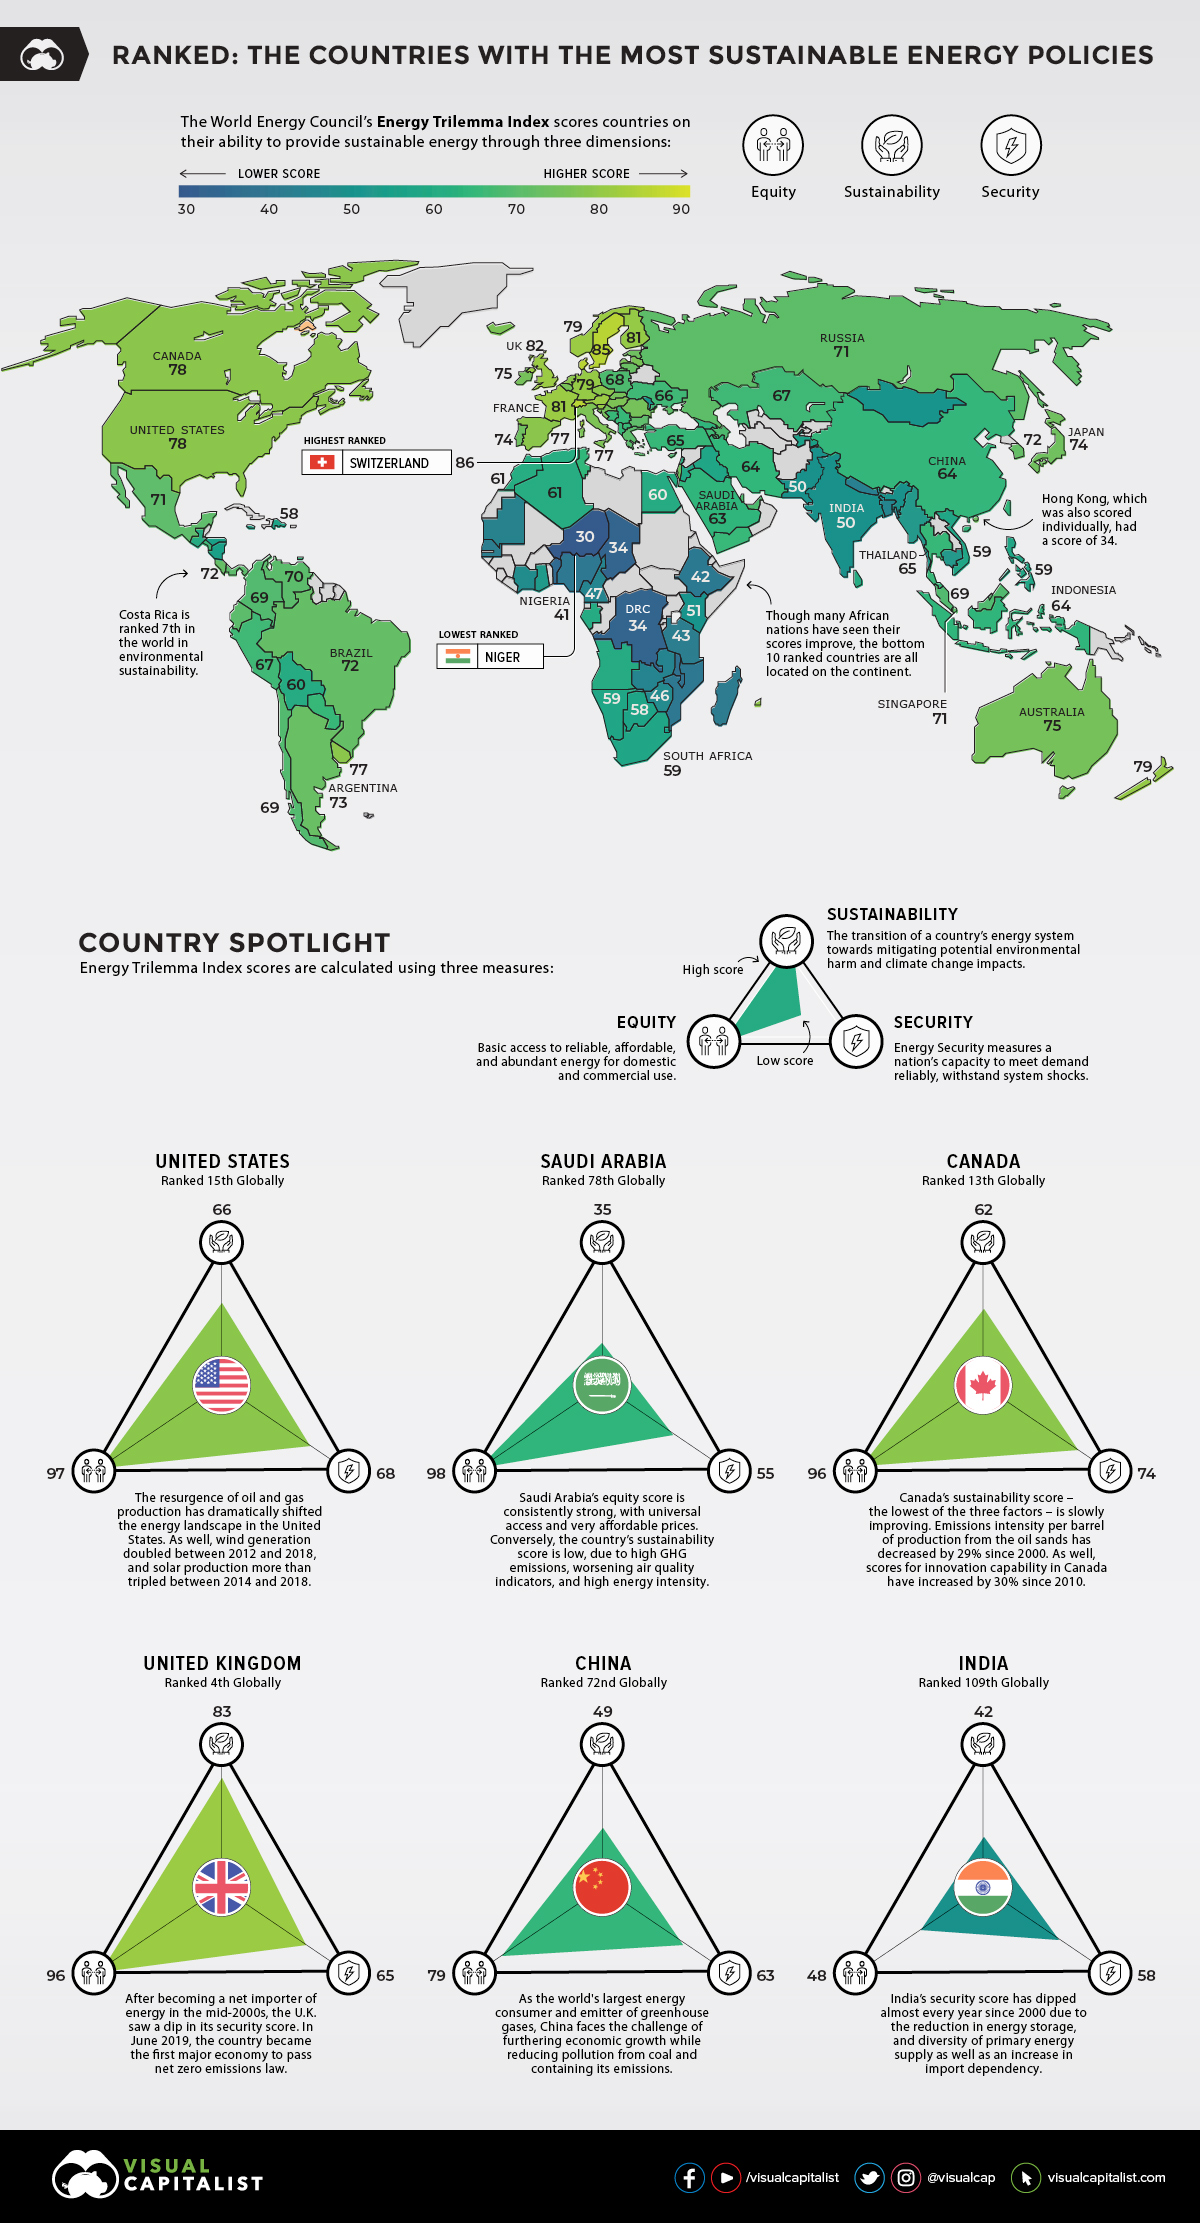
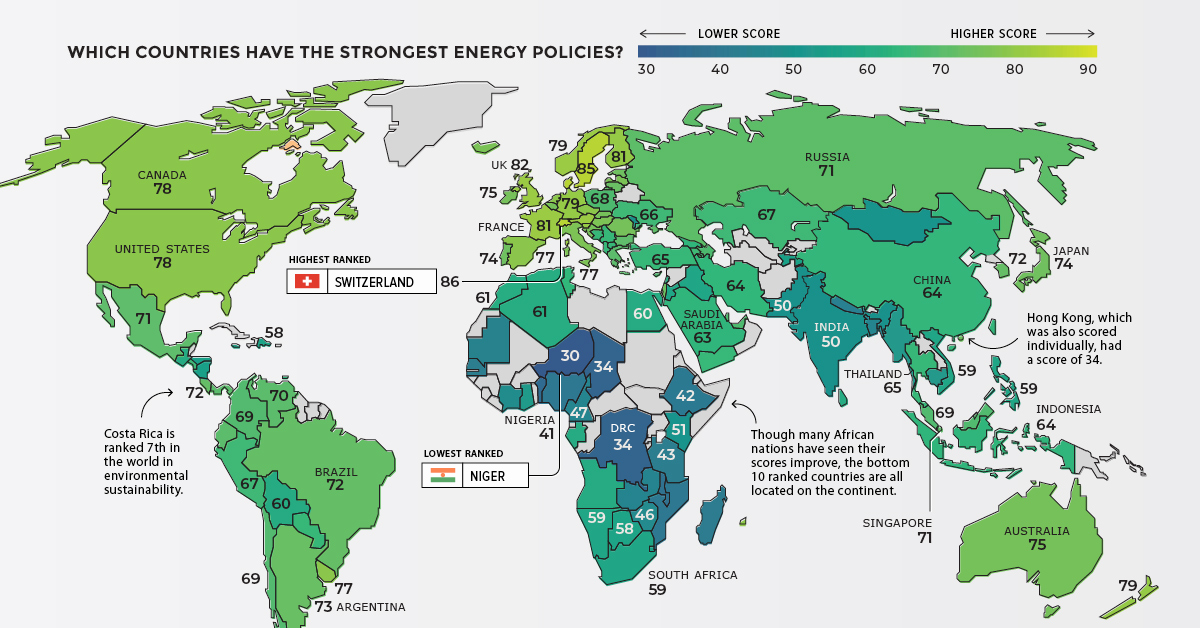
Today’s visualization – using data from the World Energy Council (WEC) – ranks countries based on their mix of policies for tackling issues like energy security and environmental sustainability.
The Energy Trilemma Index
According to WEC, there are three primary policy areas that form the “trilemma”:
1. Energy Security
A nation’s capacity to meet current and future energy demand reliably, and bounce back swiftly from system shocks with minimal disruption to supply. This dimension covers the effectiveness of management of domestic and external energy sources, as well as the reliability and resilience of energy infrastructure.
2. Energy Equity
A country’s ability to provide universal access to reliable, affordable, and abundant energy for domestic and commercial use. This dimension captures basic access to electricity and clean cooking fuels and technologies, access to prosperity-enabling levels of energy consumption, and affordability of electricity, gas, and fuel.
3. Environmental Sustainability
The transition of a country’s energy system towards mitigating and avoiding environmental harm and climate change impacts. This dimension focuses on productivity and efficiency of generation, transmission and distribution, decarbonization, and air quality.
Using the dimensions above, a score out of 100 is generated. Here’s a complete ranking that shows which countries have the most sustainable energy policies:
| Rank | Country | Trilemma Score | Letter Grade* |
|---|---|---|---|
| 1 | 🇨🇭 Switzerland | 85.8 | AAA |
| 2 | 🇸🇪 Sweden | 85.2 | AAA |
| 3 | 🇩🇰 Denmark | 84.7 | AAA |
| 4 | 🇬🇧 United Kingdom | 81.5 | AAA |
| 5 | 🇫🇮 Finland | 81.1 | AAA |
| 6 | 🇫🇷 France | 80.8 | AAA |
| 7 | 🇦🇹 Austria | 80.7 | AAA |
| 8 | 🇱🇺 Luxembourg | 80.4 | BAA |
| 9 | 🇩🇪 Germany | 79.4 | AAA |
| 10 | 🇳🇿 New Zealand | 79.4 | AAA |
| 11 | 🇳🇴 Norway | 79.3 | CAA |
| 12 | 🇸🇮 Slovenia | 79.2 | AAA |
| 13 | 🇨🇦 Canada | 78.0 | AAC |
| 14 | 🇳🇱 Netherlands | 77.8 | BAB |
| 15 | 🇺🇸 United States | 77.5 | AAB |
| 16 | 🇨🇿 Czech Republic | 77.4 | AAB |
| 17 | 🇺🇾 Uruguay | 77.2 | ABA |
| 18 | 🇪🇸 Spain | 77.0 | BAA |
| 19 | 🇭🇺 Hungary | 76.8 | AAB |
| 20 | 🇮🇹 Italy | 76.8 | BAA |
| 21 | 🇮🇸 Iceland | 76.2 | BAB |
| 22 | 🇱🇻 Latvia | 76.1 | ABA |
| 23 | 🇸🇰 Slovakia | 75.6 | ABA |
| 24 | 🇧🇪 Belgium | 75.2 | BAA |
| 25 | 🇮🇪 Ireland | 75.2 | CAA |
| 26 | 🇷🇴 Romania | 75.1 | ABA |
| 27 | 🇭🇷 Croatia | 74.9 | ABA |
| 28 | 🇦🇺 Australia | 74.7 | BAB |
| 29 | 🇵🇹 Portugal | 74.0 | BBB |
| 30 | 🇪🇪 Estonia | 73.8 | BAB |
| 31 | 🇯🇵 Japan | 73.8 | CAB |
| 32 | 🇮🇱 Israel | 73.3 | CAB |
| 33 | 🇲🇹 Malta | 72.9 | DAA |
| 34 | 🇭🇰 Hong Kong (China) | 72.5 | DAB |
| 35 | 🇦🇷 Argentina | 72.4 | BAB |
| 36 | 🇱🇹 Lithuania | 72.4 | CBA |
| 37 | 🇰🇷 South Korea | 71.7 | BAC |
| 38 | 🇨🇷 Costa Rica | 71.6 | CBA |
| 39 | 🇧🇷 Brazil | 71.6 | ABA |
| 40 | 🇲🇽 Mexico | 71.3 | ABB |
| 41 | 🇧🇬 Bulgaria | 71.3 | BBB |
| 42 | 🇷🇺 Russia | 71.2 | AAC |
| 43 | 🇸🇬 Singapore | 71.2 | DAB |
| 44 | 🇻🇪 Venezuela | 70.3 | ABB |
| 45 | 🇪🇨 Ecuador | 69.6 | ABB |
| 46 | 🇵🇦 Panama | 69.5 | CBA |
| 47 | 🇬🇷 Greece | 69.5 | CBA |
| 48 | 🇨🇱 Chile | 69.4 | BBB |
| 49 | 🇨🇴 Colombia | 69.3 | BCA |
| 50 | 🇲🇺 Mauritius | 69.0 | CBB |
| 51 | 🇲🇾 Malaysia | 68.5 | BBC |
| 52 | 🇦🇪 U.A.E. | 68.3 | BAD |
| 53 | 🇵🇱 Poland | 68.3 | BBB |
| 54 | 🇨🇾 Cyprus | 67.9 | DBB |
| 55 | 🇶🇦 Qatar | 67.9 | AAD |
| 56 | 🇧🇳 Brunei | 67.7 | CBC |
| 57 | 🇦🇿 Azerbaijan | 67.7 | BBB |
| 58 | 🇵🇪 Peru | 66.8 | ACB |
| 59 | 🇰🇿 Kazakhstan | 66.6 | BBC |
| 60 | 🇦🇲 Armenia | 66.3 | CBB |
| 61 | 🇺🇦 Ukraine | 66.0 | ACC |
| 62 | 🇸🇻 El Salvador | 66.0 | BCA |
| 63 | 🇴🇲 Oman | 65.5 | BAD |
| 64 | 🇲🇪 Montenegro | 65.4 | CBB |
| 65 | 🇰🇼 Kuwait | 65.2 | CAD |
| 66 | 🇹🇷 Turkey | 64.9 | CBC |
| 67 | 🇵🇾 Paraguay | 64.7 | DBA |
| 68 | 🇹🇭 Thailand | 64.6 | CBC |
| 69 | 🇮🇩 Indonesia | 64.1 | BCC |
| 70 | 🇷🇸 Serbia | 63.8 | BBC |
| 71 | 🇲🇰 North Macedonia | 63.7 | CBC |
| 72 | 🇨🇳 China | 63.7 | BBD |
| 73 | 🇦🇱 Albania | 63.7 | DBA |
| 74 | 🇮🇷 Iran | 63.6 | ABD |
| 75 | 🇹🇳 Tunisia | 63.6 | BBC |
| 76 | 🇹🇹 Trinidad and Tobago | 63.3 | CAD |
| 77 | 🇬🇪 Georgia | 63.1 | CBC |
| 78 | 🇸🇦 Saudi Arabia | 62.8 | CAD |
| 79 | 🇧🇦 Bosnia and Herz. | 62.1 | BBC |
| 80 | 🇧🇭 Bahrain | 62.1 | BAD |
| 81 | 🇱🇧 Lebanon | 61.6 | DAC |
| 82 | 🇩🇿 Algeria | 61.3 | CBD |
| 83 | 🇲🇦 Morocco | 61.1 | CCC |
| 84 | 🇧🇴 Bolivia | 60.4 | BCC |
| 85 | 🇱🇰 Sri Lanka | 60.1 | BCB |
| 86 | 🇦🇴 Angola | 60.0 | ADB |
| 87 | 🇪🇬 Egypt | 59.9 | BBD |
| 88 | 🇬🇹 Guatemala | 59.7 | BCC |
| 89 | 🇬🇦 Gabon | 59.5 | CBD |
| 90 | 🇳🇦 Namibia | 59.1 | CDA |
| 91 | 🇻🇳 Vietnam | 58.9 | ACD |
| 92 | 🇿🇦 South Africa | 58.9 | DBD |
| 93 | 🇮🇶 Iraq | 58.9 | BBD |
| 94 | 🇵🇭 Philippines | 58.6 | BCC |
| 95 | 🇯🇴 Jordan | 58.5 | DBC |
| 96 | 🇧🇼 Botswana | 57.7 | DCC |
| 97 | 🇩🇴 Dominican Republic | 57.6 | DBB |
| 98 | 🇯🇲 Jamaica | 56.9 | DBC |
| 99 | 🇹🇯 Tajikistan | 55.7 | DCC |
| 100 | 🇭🇳 Honduras | 55.3 | DCC |
| 101 | 🇸🇿 Eswatini | 55.1 | DCC |
| 102 | 🇳🇮 Nicaragua | 54.5 | DCC |
| 103 | 🇬🇭 Ghana | 52.9 | CDC |
| 104 | 🇲🇲 Myanmar | 51.9 | BDB |
| 105 | 🇰🇭 Cambodia | 51.6 | CDC |
| 106 | 🇰🇪 Kenya | 51.3 | BDB |
| 107 | 🇲🇩 Moldova | 51.2 | DCD |
| 108 | 🇲🇳 Mongolia | 51.1 | DCD |
| 109 | 🇮🇳 India | 50.3 | BDD |
| 110 | 🇵🇰 Pakistan | 49.6 | CDD |
| 111 | 🇨🇮 Côte d’Ivoire | 49.3 | BDC |
| 112 | 🇿🇲 Zambia | 47.8 | CDB |
| 113 | 🇨🇲 Cameroon | 47.4 | BDD |
| 114 | 🇧🇩 Bangladesh | 47.1 | DDC |
| 115 | 🇿🇼 Zimbabwe | 46.0 | CDC |
| 116 | 🇲🇷 Mauritania | 45.6 | BDD |
| 117 | 🇳🇵 Nepal | 44.3 | DDC |
| 118 | 🇸🇳 Senegal | 43.4 | DDD |
| 119 | 🇹🇿 Tanzania | 42.5 | DDC |
| 120 | 🇪🇹 Ethiopia | 42.3 | DDC |
| 121 | 🇲🇬 Madagascar | 42.2 | CDC |
| 122 | 🇲🇿 Mozambique | 41.4 | DDC |
| 123 | 🇳🇬 Nigeria | 40.7 | BDD |
| 124 | 🇲🇼 Malawi | 39.1 | DDB |
| 125 | 🇧🇯 Benin | 36.3 | DDD |
| 126 | 🇹🇩 Chad | 33.8 | DDD |
| 127 | 🇨🇩 D.R.C. | 33.8 | DDC |
| 128 | 🇳🇪 Niger | 30.0 | DDD |
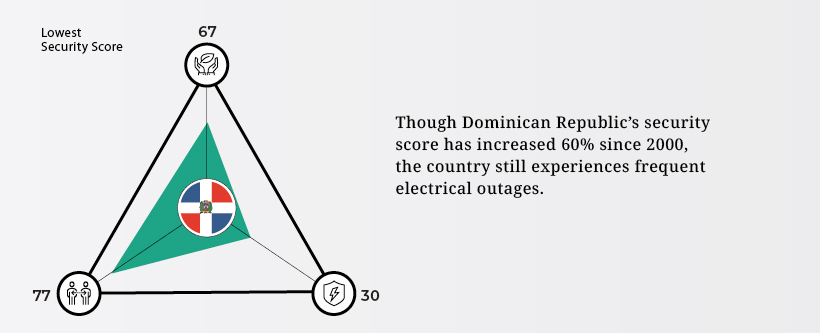
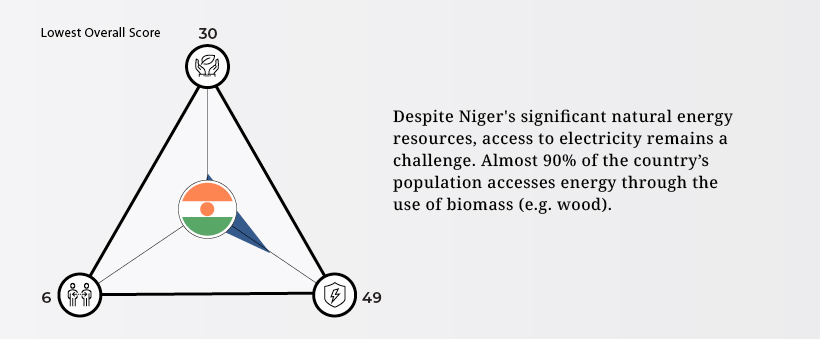
*The letter grade represents national performance in three dimensions. The first letter represents Security, the second letter represents Equity, the third letter represents the Environmental Sustainability. The top grade is AAA, the lowest is DDD.
Highs, Lows, and Outliers
Every country has unique circumstances — from strategic energy reserves to green energy ambitions — that shape their domestic energy policies. Let’s take a closer look at some of the more interesting situations around the world.
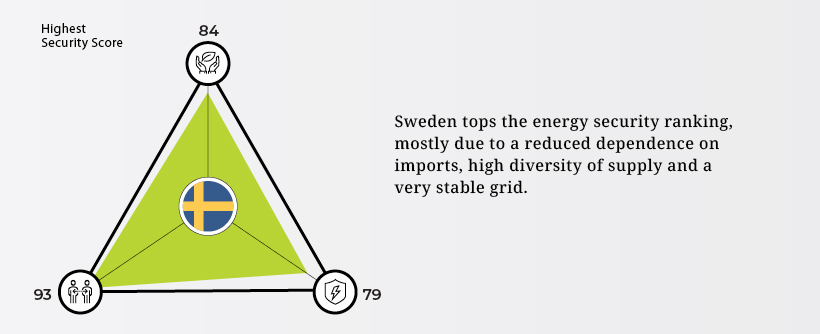
Sweden
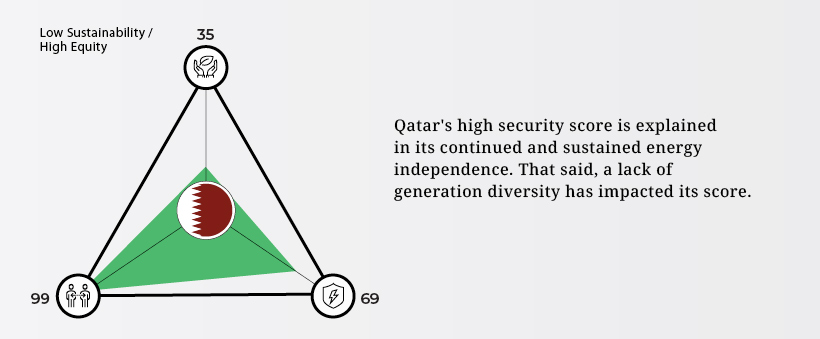
Qatar
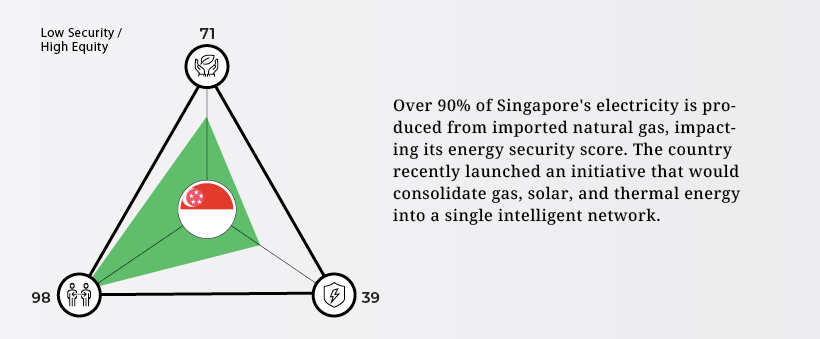
Singapore
Dominican Republic
Niger
Global Energy Outlook
Achieving the balance of prosperity and sustainability is a goal of nearly every country, but it takes stability and the right mix of policies to get the job done.
The fact that many trilemma scores are improving is an indicator that the world’s patchwork of energy policies are slowly moving in the right direction.
Energy
Charted: 4 Reasons Why Lithium Could Be the Next Gold Rush
Visual Capitalist has partnered with EnergyX to show why drops in prices and growing demand may make now the right time to invest in lithium.


4 Reasons Why You Should Invest in Lithium
Lithium’s importance in powering EVs makes it a linchpin of the clean energy transition and one of the world’s most precious minerals.
In this graphic, Visual Capitalist partnered with EnergyX to explore why now may be the time to invest in lithium.
1. Lithium Prices Have Dropped
One of the most critical aspects of evaluating an investment is ensuring that the asset’s value is higher than its price would indicate. Lithium is integral to powering EVs, and, prices have fallen fast over the last year:
| Date | LiOH·H₂O* | Li₂CO₃** |
|---|---|---|
| Feb 2023 | $76 | $71 |
| March 2023 | $71 | $61 |
| Apr 2023 | $43 | $33 |
| May 2023 | $43 | $33 |
| June 2023 | $47 | $45 |
| July 2023 | $44 | $40 |
| Aug 2023 | $35 | $35 |
| Sept 2023 | $28 | $27 |
| Oct 2023 | $24 | $23 |
| Nov 2023 | $21 | $21 |
| Dec 2023 | $17 | $16 |
| Jan 2024 | $14 | $15 |
| Feb 2024 | $13 | $14 |
Note: Monthly spot prices were taken as close to the 14th of each month as possible.
*Lithium hydroxide monohydrate MB-LI-0033
**Lithium carbonate MB-LI-0029
2. Lithium-Ion Battery Prices Are Also Falling
The drop in lithium prices is just one reason to invest in the metal. Increasing economies of scale, coupled with low commodity prices, have caused the cost of lithium-ion batteries to drop significantly as well.
In fact, BNEF reports that between 2013 and 2023, the price of a Li-ion battery dropped by 82%.
| Year | Price per KWh |
|---|---|
| 2023 | $139 |
| 2022 | $161 |
| 2021 | $150 |
| 2020 | $160 |
| 2019 | $183 |
| 2018 | $211 |
| 2017 | $258 |
| 2016 | $345 |
| 2015 | $448 |
| 2014 | $692 |
| 2013 | $780 |

3. EV Adoption is Sustainable
One of the best reasons to invest in lithium is that EVs, one of the main drivers behind the demand for lithium, have reached a price point similar to that of traditional vehicle.
According to the Kelly Blue Book, Tesla’s average transaction price dropped by 25% between 2022 and 2023, bringing it in line with many other major manufacturers and showing that EVs are a realistic transport option from a consumer price perspective.
| Manufacturer | September 2022 | September 2023 |
|---|---|---|
| BMW | $69,000 | $72,000 |
| Ford | $54,000 | $56,000 |
| Volkswagon | $54,000 | $56,000 |
| General Motors | $52,000 | $53,000 |
| Tesla | $68,000 | $51,000 |
4. Electricity Demand in Transport is Growing
As EVs become an accessible transport option, there’s an investment opportunity in lithium. But possibly the best reason to invest in lithium is that the IEA reports global demand for the electricity in transport could grow dramatically by 2030:
| Transport Type | 2022 | 2025 | 2030 |
|---|---|---|---|
| Buses 🚌 | 23,000 GWh | 50,000 GWh | 130,000 GWh |
| Cars 🚙 | 65,000 GWh | 200,000 GWh | 570,000 GWh |
| Trucks 🛻 | 4,000 GWh | 15,000 GWh | 94,000 GWh |
| Vans 🚐 | 6,000 GWh | 16,000 GWh | 72,000 GWh |
The Lithium Investment Opportunity
Lithium presents a potentially classic investment opportunity. Lithium and battery prices have dropped significantly, and recently, EVs have reached a price point similar to other vehicles. By 2030, the demand for clean energy, especially in transport, will grow dramatically.
With prices dropping and demand skyrocketing, now is the time to invest in lithium.
EnergyX is poised to exploit lithium demand with cutting-edge lithium extraction technology capable of extracting 300% more lithium than current processes.

-

 Lithium4 days ago
Ranked: The Top 10 EV Battery Manufacturers in 2023
Asia dominates this ranking of the world’s largest EV battery manufacturers in 2023.
-

 Energy1 week ago
The World’s Biggest Nuclear Energy Producers
China has grown its nuclear capacity over the last decade, now ranking second on the list of top nuclear energy producers.
-

 Energy1 month ago
The World’s Biggest Oil Producers in 2023
Just three countries accounted for 40% of global oil production last year.
-

 Energy1 month ago
How Much Does the U.S. Depend on Russian Uranium?
Currently, Russia is the largest foreign supplier of nuclear power fuel to the U.S.
-

 Uranium2 months ago
Charted: Global Uranium Reserves, by Country
We visualize the distribution of the world’s uranium reserves by country, with 3 countries accounting for more than half of total reserves.
-

 Energy3 months ago
Visualizing the Rise of the U.S. as Top Crude Oil Producer
Over the last decade, the United States has established itself as the world’s top producer of crude oil, surpassing Saudi Arabia and Russia.

-

 Education1 week ago
How Hard Is It to Get Into an Ivy League School?
-

 Technology2 weeks ago
Ranked: Semiconductor Companies by Industry Revenue Share
-

 Markets2 weeks ago
Ranked: The World’s Top Flight Routes, by Revenue
-

 Demographics2 weeks ago
Population Projections: The World’s 6 Largest Countries in 2075
-

 Markets2 weeks ago
The Top 10 States by Real GDP Growth in 2023
-

 Demographics2 weeks ago
The Smallest Gender Wage Gaps in OECD Countries
-

 Economy2 weeks ago
Where U.S. Inflation Hit the Hardest in March 2024
-

 Green2 weeks ago
Top Countries By Forest Growth Since 2001