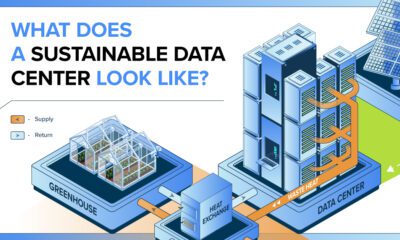

Data centers produce a staggering amount of heat, but what if instead of treating it as waste, we could harness it instead?
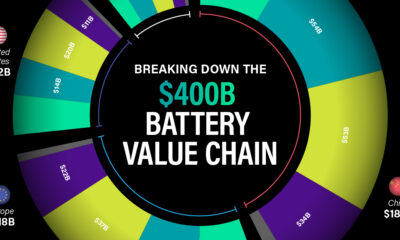

In this graphic, we break down where the $400 billion lithium battery industry will generate revenue in 2030.
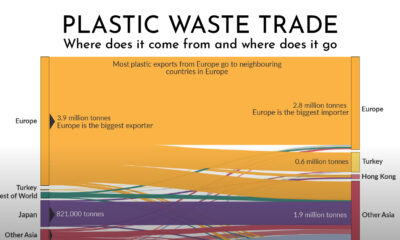

Which countries are responsible for exporting the world's plastic waste? This graphic shows the flow of global plastic waste through exports and imports.
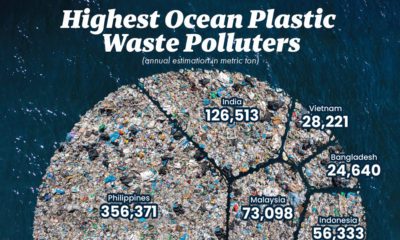

This graphic visualizes the top 10 countries emitting plastic pollutants into our oceans.
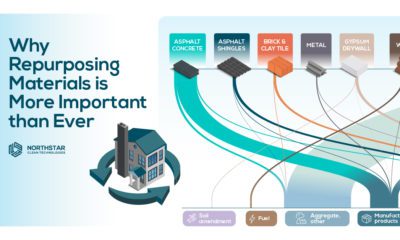

Globally around 2 billion tonnes of waste is generated every year and the construction industry is a large contributor.
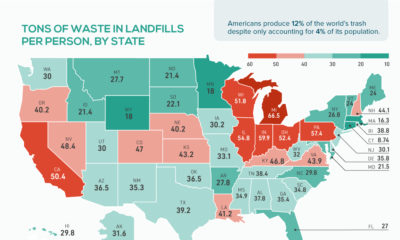

The U.S. is the world’s most wasteful country. In this graphic by Northstar Clean Technologies, we map tons of waste in landfills per person, by state.
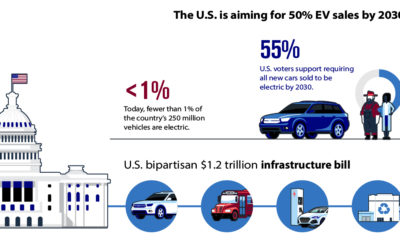

The U.S. is accelerating its transition to electric vehicles but obtaining the minerals and metals required for EVs remains a challenge. In this infographic, we explore...
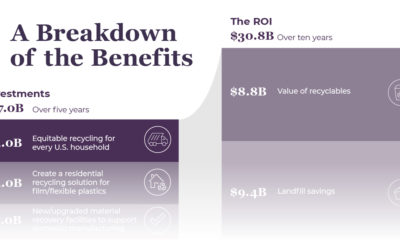

Nearly 40 million U.S. households have little to no access to recycling. Why is now the opportune time to fix recycling in America?
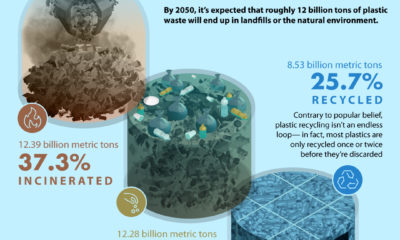

By 2050, about 37% of all the world’s plastic waste is expected to end up in our landfills or in the natural environment.
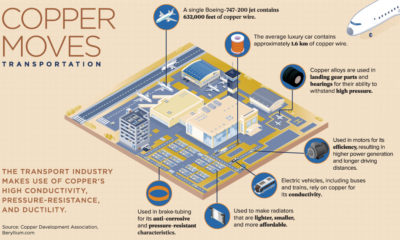

We use copper everywhere in our daily lives. This infographic highlights the uses of copper and its applications in various industries.


 Creator Program