Misc
A Visual Timeline of the Tallest Historical Structures
Humans have been building things since the dawn of time. As the tools and technology at our disposal have improved dramatically, so have the scale and magnitude of our creations.
Today’s infographic from Alan’s Factory Outlet visualizes some of the most impressive feats of construction and engineering in a historical timeline of the world’s tallest structures.
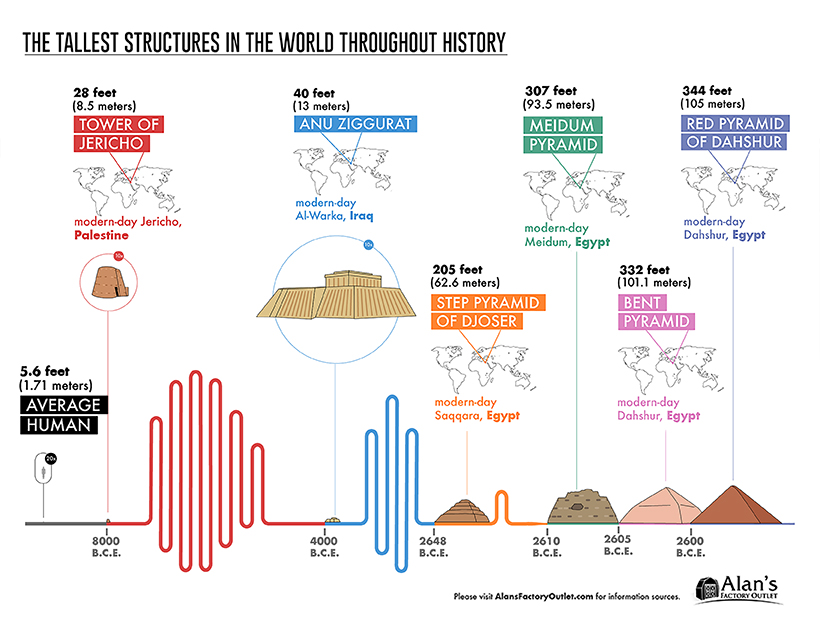
The Stone Age: 8000 — 2570 BCE
We’ll begin with one of humanity’s earliest stone monuments.
Experts estimate that the Tower of Jericho in modern-day Palestine, took 11,000 working days to construct—roughly 30 to 40 years—and is thought to have served as flood protection, and to mark the summer solstice. According to some archaeologists, it also inspired awe to “motivate people [into] a communal lifestyle”.
View the full timeline by clicking here.
The next significant structure was built nearly 4,000 years later. The Anu Ziggurat (White Temple) is located in Uruk, the ancient city of Sumer. Towering over the city’s defensive walls and visible from afar, it symbolized the city’s political power at the time.
Egypt’s era of pyramids was ushered in with the Step Pyramid of Djoser. A few decades later, the founding pharaoh Sneferu is credited for the vision behind the three major Egyptian pyramids—the Meidum, Bent, and Red Pyramids of Dahshur. The different designs reflect both the engineering shortfalls and advancements experienced during their construction…eventually leading to the most monumental pyramid of all.
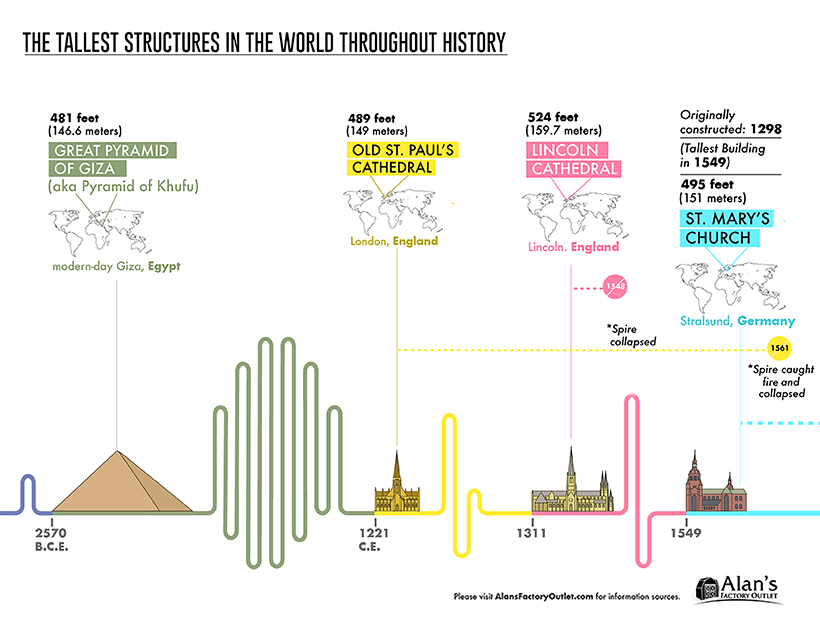
The Great Pyramid of Giza is the oldest of the ancient world wonders, and the only one that is still intact today. It weighs an estimated 6 million tonnes—and rising up at 481 feet (147 meters), it was unsurpassed as the tallest structure for thousands of years.
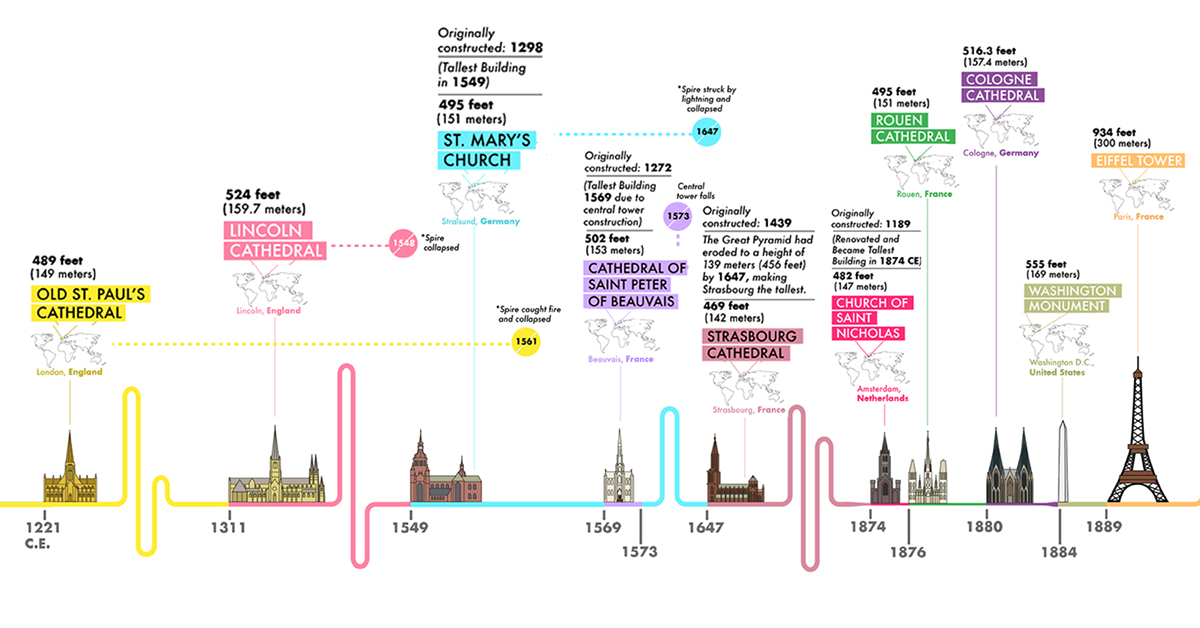
Cathedral Creation: 1221 — 1549 CE
The timeline below skips ahead over 3,000 years after the construction of the Great Pyramid, as the reign of cathedrals begins to take over, starting with the Old St. Paul’s Cathedral in 1221—which needed over 200 years to complete.
View the full timeline by clicking here.
The Lincoln Cathedral enjoyed its title of tallest structure for over 200 years, until the St. Mary’s Church in Germany was constructed. However, all three of these cathedrals suffered serious damage for some reason or another: towers or spires collapsed, the buildings caught on fire, or were struck by lightning.
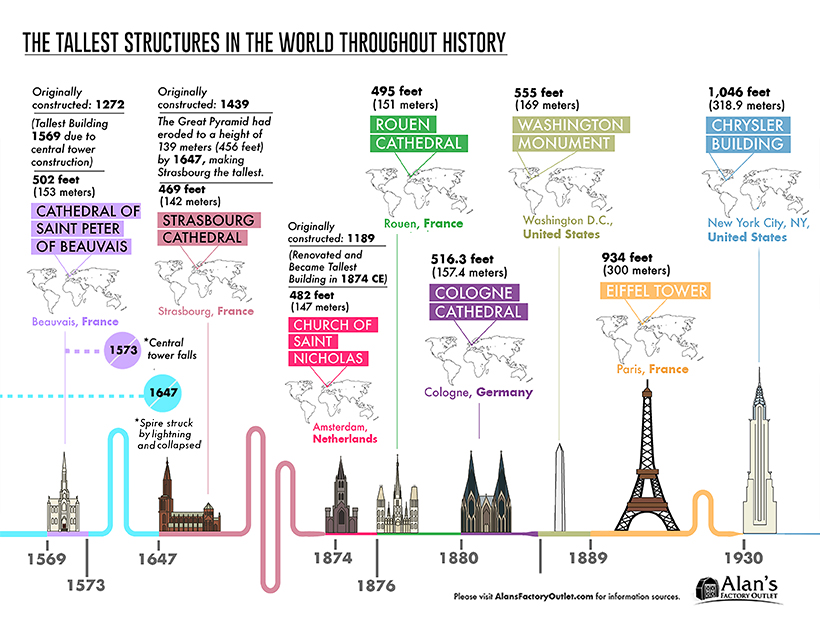
From Churches to the Chrysler: 1569 — 1930
The construction of religious monuments continued well into the late 19th century, with the Cathedral of Saint Peter of Beauvais to the Cologne cathedral. Several cathedrals were originally constructed years prior, but only gained the title of tallest structure once the Great Pyramid had significantly eroded by about 33 feet (10 meters).
View the full timeline by clicking here.
The Washington Monument, the world’s tallest obelisk, was created in memoriam of the first U.S. President. Though the majority of the Monument is marble, its apex is aluminum and bears several inscriptions on each face.
The Eiffel Tower likely needs no introduction—the Parisian cultural icon became the tallest in the world in 1889. The wrought-iron lattice structure costed close to 8 million gold Francs, or US$1.5 million to build.
Finally, the Chrysler Building’s art-deco architectural style drew criticism and rave reviews in equal measure. Born out of a skyscraper boom in New York City, it was the first to rise above 1,000 feet—toppling the Eiffel Tower’s tallest title in 1930.
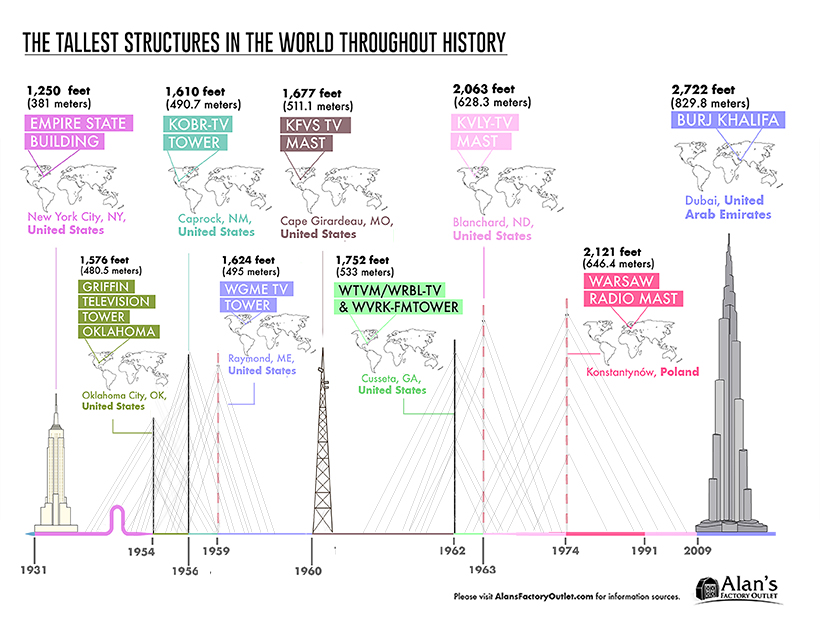
Bigger, Better, Glitzier: 1931 — Present
The “race for the sky” continues with the Empire State Building, an essential contribution to the classic New York City skyline—which cements its place as one of the seven wonders of the modern world.
View the full timeline by clicking here.
Between 1954 and 1991, the tallest man-made constructions were all TV towers, mostly located across the United States, and the Warsaw Radio Mast in Poland. That’s not to say there was a gap in skyscrapers during this time—in fact, it was quite the opposite all around the world.
Saving the best for last, the Burj Khalifa was completed in five years and costed a whopping $1.5 billion. At an impressive 163 floors (2,722 feet or 830 meters), Dubai’s incredible achievement shatters all world records for tallest structures—coming in at nearly 100 times higher than the Tower of Jericho, where this visual timeline first began.


VC+
VC+: Get Our Key Takeaways From the IMF’s World Economic Outlook
A sneak preview of the exclusive VC+ Special Dispatch—your shortcut to understanding IMF’s World Economic Outlook report.

Have you read IMF’s latest World Economic Outlook yet? At a daunting 202 pages, we don’t blame you if it’s still on your to-do list.
But don’t worry, you don’t need to read the whole April release, because we’ve already done the hard work for you.
To save you time and effort, the Visual Capitalist team has compiled a visual analysis of everything you need to know from the report—and our VC+ Special Dispatch is available exclusively to VC+ members. All you need to do is log into the VC+ Archive.
If you’re not already subscribed to VC+, make sure you sign up now to access the full analysis of the IMF report, and more (we release similar deep dives every week).
For now, here’s what VC+ members get to see.
Your Shortcut to Understanding IMF’s World Economic Outlook
With long and short-term growth prospects declining for many countries around the world, this Special Dispatch offers a visual analysis of the key figures and takeaways from the IMF’s report including:
- The global decline in economic growth forecasts
- Real GDP growth and inflation forecasts for major nations in 2024
- When interest rate cuts will happen and interest rate forecasts
- How debt-to-GDP ratios have changed since 2000
- And much more!

Get the Full Breakdown in the Next VC+ Special Dispatch
VC+ members can access the full Special Dispatch by logging into the VC+ Archive, where you can also check out previous releases.
Make sure you join VC+ now to see exclusive charts and the full analysis of key takeaways from IMF’s World Economic Outlook.
Don’t miss out. Become a VC+ member today.
What You Get When You Become a VC+ Member
VC+ is Visual Capitalist’s premium subscription. As a member, you’ll get the following:
- Special Dispatches: Deep dive visual briefings on crucial reports and global trends
- Markets This Month: A snappy summary of the state of the markets and what to look out for
- The Trendline: Weekly curation of the best visualizations from across the globe
- Global Forecast Series: Our flagship annual report that covers everything you need to know related to the economy, markets, geopolitics, and the latest tech trends
- VC+ Archive: Hundreds of previously released VC+ briefings and reports that you’ve been missing out on, all in one dedicated hub
You can get all of the above, and more, by joining VC+ today.

-

 Mining1 week ago
Gold vs. S&P 500: Which Has Grown More Over Five Years?
-

 Markets2 weeks ago
Ranked: The Most Valuable Housing Markets in America
-

 Money2 weeks ago
Which States Have the Highest Minimum Wage in America?
-

 AI2 weeks ago
Ranked: Semiconductor Companies by Industry Revenue Share
-

 Markets2 weeks ago
Ranked: The World’s Top Flight Routes, by Revenue
-

 Countries2 weeks ago
Population Projections: The World’s 6 Largest Countries in 2075
-

 Markets2 weeks ago
The Top 10 States by Real GDP Growth in 2023
-

 Demographics2 weeks ago
The Smallest Gender Wage Gaps in OECD Countries