Misc
The Topography of Mars: Visualizing an Alien Landscape
The Topography of Mars: Visualizing an Alien Landscape
The surface of the Red Planet is full of surprises.
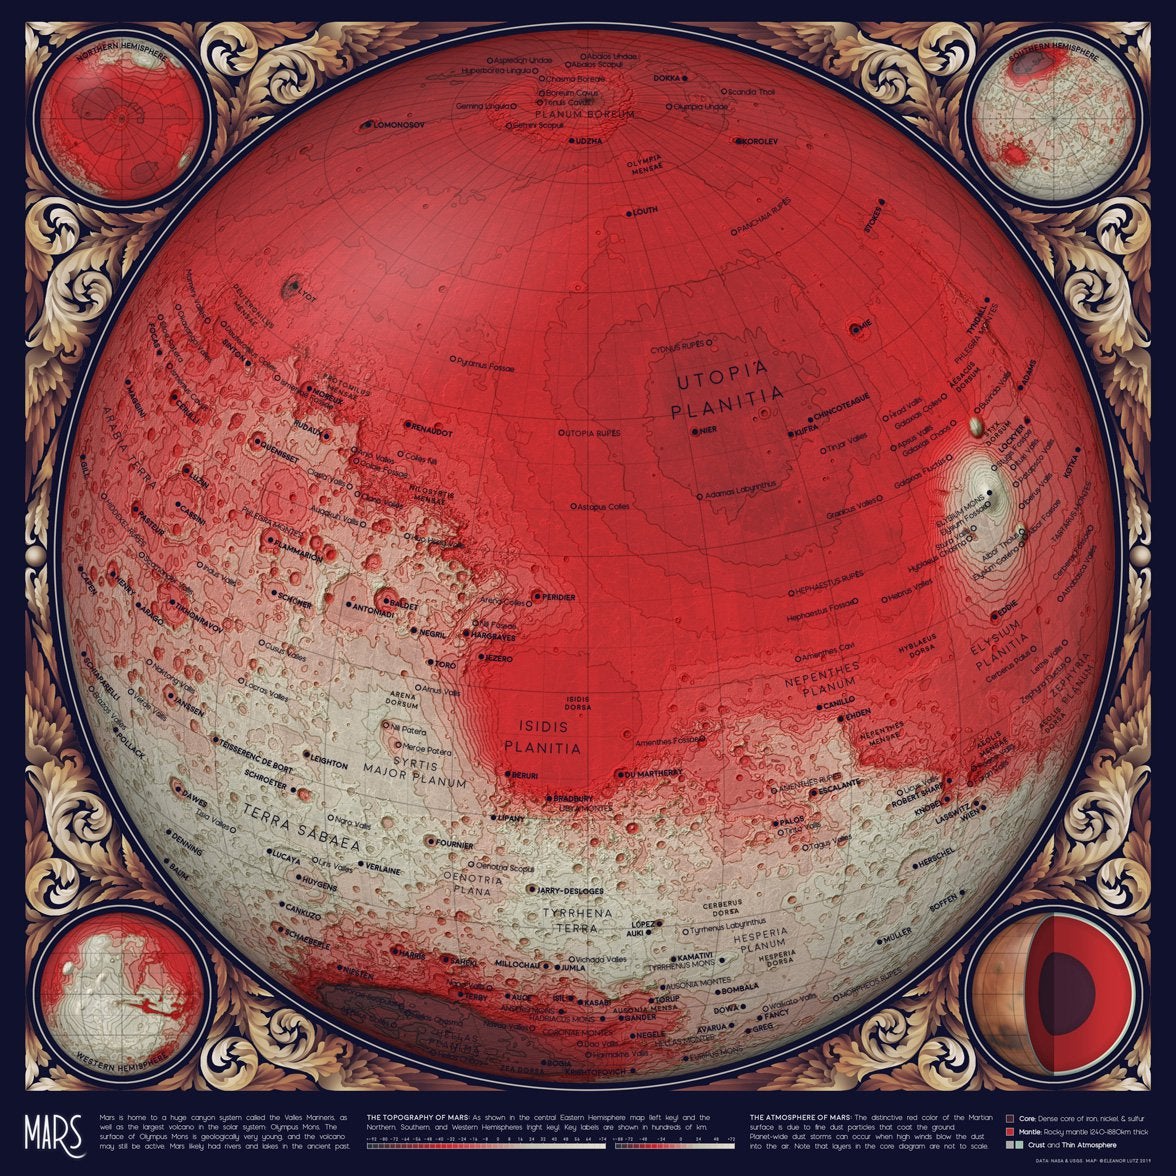
While the Grand Canyon and Mount Everest are both impressive features on Earth, they are nothing next to Valles Marineris and Olympus Mons, their epic Martian counterparts.
Even more extraordinary, the overall difference between the highest and lowest point on Mars is 19 miles (31 km), whereas just 12 miles (20 km) separates the summit of Mount Everest from the bottom of the Mariana Trench on Earth.
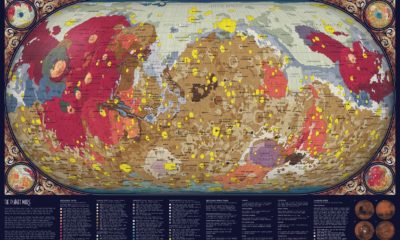
This week’s map comes to us from Reddit user /hellofromthemoon, who carefully laid out the terrain of Mars in awesome detail.
Take a look…
Lay of the Land
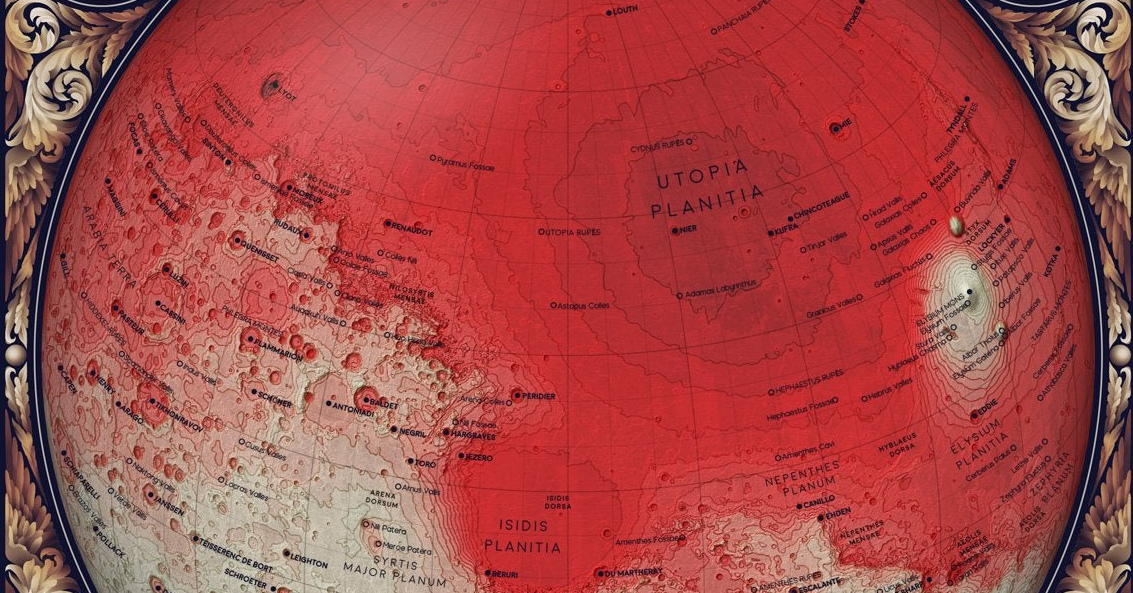
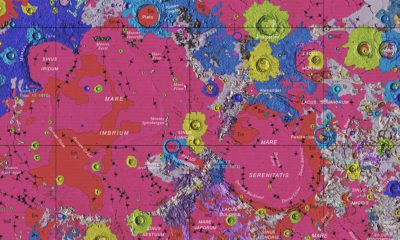
Mars can be divided into two major regions, separated by a ridge of mountains roughly around the planet’s middle.
On the north side are lowlands that have been shaped by lava flows, creating a surface dominated by large plains. Meanwhile, the southern hemisphere is mountainous, with many meteorite impact craters, some of which stretch for hundreds of kilometers.
The Plains Game
The plains of Mars fall into two categories: the planitia (Latin for “plains”) and the maria (Latin for “seas”). The latter type is named after the sea because these regions appeared to be under water in the eyes of early astronomers. But actually, the surfaces of these regions are covered with many rocks, making them look darker to the eye.
The second type of plains are the planitia, and they account for vast areas covered by sand rich in iron oxide. The strong winds that blow the sand and dust around can change the configuration of the plains, forming new patterns on the surface of Mars. However, the planet’s features remain relatively unchanged over time.
One of the largest plains is the Utopia Planitia (Latin for “Nowhere Land Plain”) impact basin. This giant impact crater lies within a larger lava plain. With an estimated diameter of 3,300 km, Utopia Planitia is the largest recognized impact basin in the solar system.
As Above, so Below
The northern and southern hemispheres are vastly different from one another on Mars, and such a stark difference is unlike any other planet in the solar system. Patterns of internal magma flow could have caused the variation, but some scientists think it is the result of Mars taking one or several major impacts.
About 4.5 billion years ago, Mars formed from the collection of rocks that circle the sun before they formed the planets. Over time, the red planet’s molten masses differentiated into a core, a mantle, and an outer crust.
Understanding how the red planet’s topography changes over time is a crucial step in grasping how the planet formed. That is why NASA launched the InSight Mars lander on May 5, 2019. This probe will listen for vibrations deep within the Martian crust to further understand the composition of the planet.
Site Selection
Understanding the topography of Mars is critical for any mission to the planet, including the selection of a site for a potential colony. There are three basic criteria for picking a manned mission landing site:
- A spot that is sustainable in terms of water, energy generation, and building materials.
- A spot that is scientifically interesting for a long mission.
- A spot that is safe to land.
Brian Hynek, a planetary scientist and Director of the Center for Astrobiology at the University of Colorado at Boulder, offers five potential landing sites:
- Outer edge of Mars’ North polar ice cap
- Deep canyon of Valles Marineris
- Martian “glaciers” in the Hellas Basin near Mars’ mid-latitudes
- Arabia Terra
- Martian lava tubes and caves
With growing information from every new mission to Mars, a greater picture will help guide future human activity and ambitions on the planet.


VC+
VC+: Get Our Key Takeaways From the IMF’s World Economic Outlook
A sneak preview of the exclusive VC+ Special Dispatch—your shortcut to understanding IMF’s World Economic Outlook report.

Have you read IMF’s latest World Economic Outlook yet? At a daunting 202 pages, we don’t blame you if it’s still on your to-do list.
But don’t worry, you don’t need to read the whole April release, because we’ve already done the hard work for you.
To save you time and effort, the Visual Capitalist team has compiled a visual analysis of everything you need to know from the report—and our VC+ Special Dispatch is available exclusively to VC+ members. All you need to do is log into the VC+ Archive.
If you’re not already subscribed to VC+, make sure you sign up now to access the full analysis of the IMF report, and more (we release similar deep dives every week).
For now, here’s what VC+ members get to see.
Your Shortcut to Understanding IMF’s World Economic Outlook
With long and short-term growth prospects declining for many countries around the world, this Special Dispatch offers a visual analysis of the key figures and takeaways from the IMF’s report including:
- The global decline in economic growth forecasts
- Real GDP growth and inflation forecasts for major nations in 2024
- When interest rate cuts will happen and interest rate forecasts
- How debt-to-GDP ratios have changed since 2000
- And much more!

Get the Full Breakdown in the Next VC+ Special Dispatch
VC+ members can access the full Special Dispatch by logging into the VC+ Archive, where you can also check out previous releases.
Make sure you join VC+ now to see exclusive charts and the full analysis of key takeaways from IMF’s World Economic Outlook.
Don’t miss out. Become a VC+ member today.
What You Get When You Become a VC+ Member
VC+ is Visual Capitalist’s premium subscription. As a member, you’ll get the following:
- Special Dispatches: Deep dive visual briefings on crucial reports and global trends
- Markets This Month: A snappy summary of the state of the markets and what to look out for
- The Trendline: Weekly curation of the best visualizations from across the globe
- Global Forecast Series: Our flagship annual report that covers everything you need to know related to the economy, markets, geopolitics, and the latest tech trends
- VC+ Archive: Hundreds of previously released VC+ briefings and reports that you’ve been missing out on, all in one dedicated hub
You can get all of the above, and more, by joining VC+ today.

-

 Debt1 week ago
How Debt-to-GDP Ratios Have Changed Since 2000
-

 Markets2 weeks ago
Ranked: The World’s Top Flight Routes, by Revenue
-

 Countries2 weeks ago
Population Projections: The World’s 6 Largest Countries in 2075
-

 Markets2 weeks ago
The Top 10 States by Real GDP Growth in 2023
-

 Demographics2 weeks ago
The Smallest Gender Wage Gaps in OECD Countries
-

 United States2 weeks ago
Where U.S. Inflation Hit the Hardest in March 2024
-

 Green2 weeks ago
Top Countries By Forest Growth Since 2001
-

 United States2 weeks ago
Ranked: The Largest U.S. Corporations by Number of Employees