Mining
Mapped: The Geology of the Moon in Astronomical Detail
View the medium resolution version of this map (9mb) | View the full resolution version of this map (47mb)
View the medium resolution version of this map (9mb) | View the full resolution version of this map (47mb)
Mapped: The Geology of the Moon in Astronomical Detail
If you were to land on the Moon, where would you go?
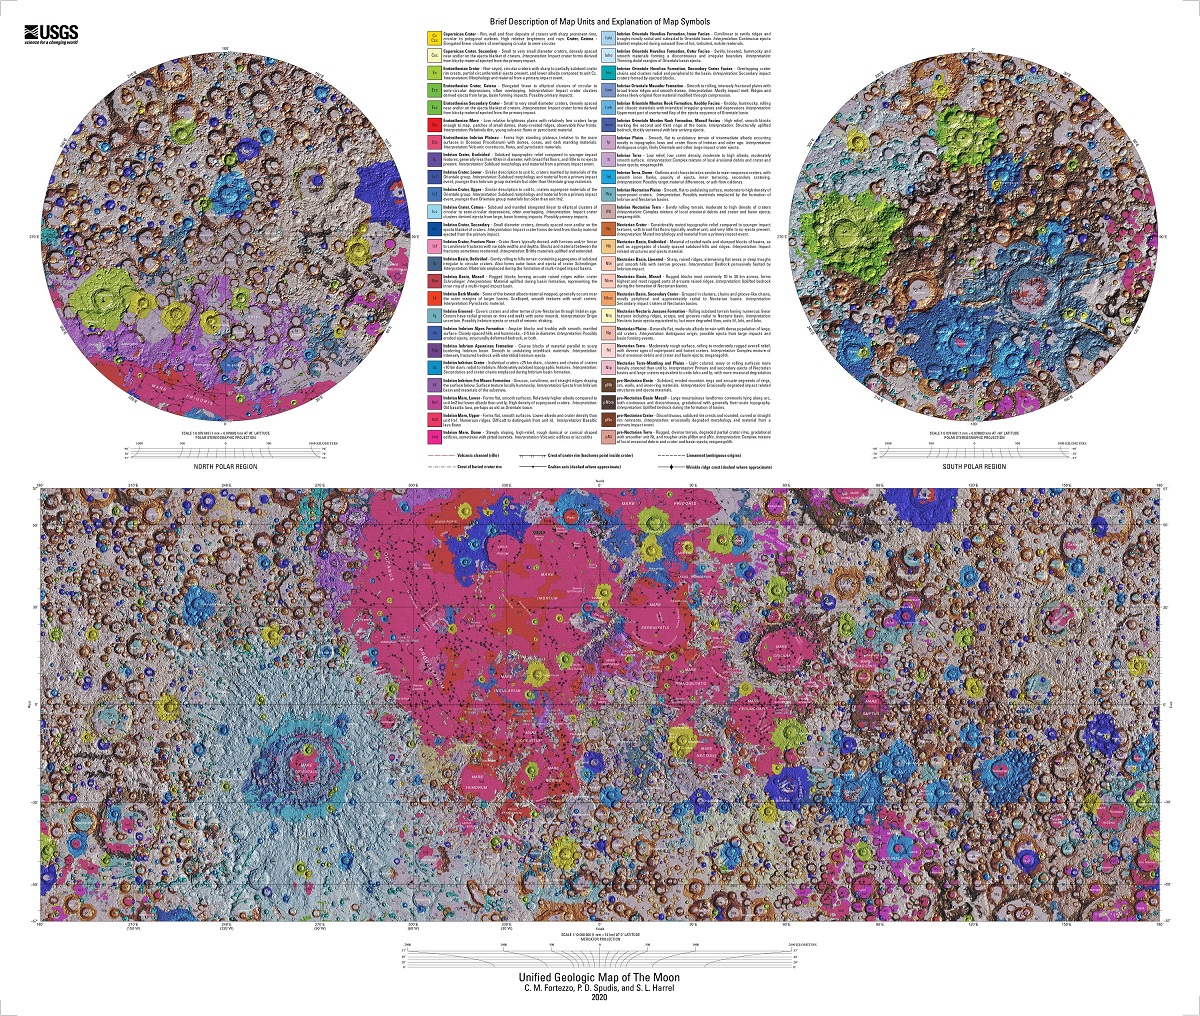
Today’s post is the incredible Unified Geologic Map of the Moon from the USGS, which combines information from six regional lunar maps created during the Apollo era, as well as recent spacecraft observations.
Feet on the Ground, Head in the Sky
Since the beginning of humankind, the Moon has captured our collective imagination. It is one of the few celestial bodies visible to the naked eye from Earth. Over time different cultures wrapped the Moon in their own myths. To the Egyptians it was the god Thoth, to the Greeks, the goddess Artemis, and to the Hindus, Chandra.
Thoth was portrayed as a wise counselor who solved disputes and invented writing and the 365-day calendar. A headdress with a lunar disk sitting atop a crescent moon denoted Thoth as the arbiter of times and seasons.
Artemis was the twin sister of the sun god Apollo, and in Greek mythology she presided over childbirth, fertility, and the hunt. Just like her brother that illuminated the day, she was referred to as the torch bringer during the dark of night.
Chandra means the “Moon” in Sanskrit, Hindi, and other Indian languages. According to one Hindu legend, Ganesha—an elephant-headed deity—was returning home on a full moon night after a feast. On the journey, a snake crossed his pathway, frightening his horse. An overstuffed Ganesha fell to the ground on his stomach, vomiting out his dinner. On observing this, Chandra laughed, causing Ganesha to lose his temper. He broke off one of his tusks and hurled it toward the Moon, cursing him so that he would never be whole again. This legend describes the Moon’s waxing and waning including the big crater on the Moon, visible from Earth.
Such lunar myths have waned as technology has evolved, removing the mystery of the Moon but also opening up scientific debate.
Celestial Evolution: Two Theories
The pot marks on the Moon can be easily seen from the Earth’s surface with the naked eye, and it has led to numerous theories as to the history of the Moon. Recent scientific study brings forward two primary ideas.
One opinion of those who have studied the Moon is that it was once a liquid mass, and that its craters represent widespread and prolonged volcanic activity, when the gases and lava of the heated interior exploded to the surface.
However, there is another explanation for these lunar craters. According to G. K. Gilbert, of the USGS, the Moon was formed by the joining of a ring of meteorites which once encircled the Earth, and after the formation of the lunar sphere, the impact of meteors produced “craters” instead of arising from volcanic activity.
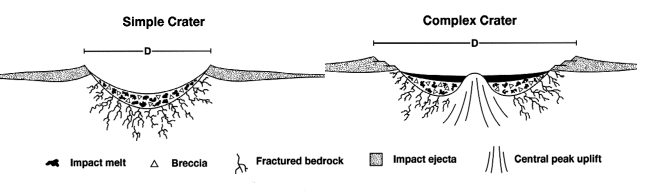
Either way, mapping the current contours of the lunar landscape will guide future human missions to the Moon by revealing regions that may be rich in useful resources or areas that need more detailed mapping to land a spacecraft safely .
Lay of the Land: Reading the Contours of the Moon
This map is a 1:5,000,000-scale geologic map built from six separate digital maps. The goal was to create a resource for science research and analysis to support future geologic mapping efforts.
Mapping purposes divide the Moon into the near side and far side. The far side of the Moon is the side that always faces away from the Earth, while the near side faces towards the Earth.
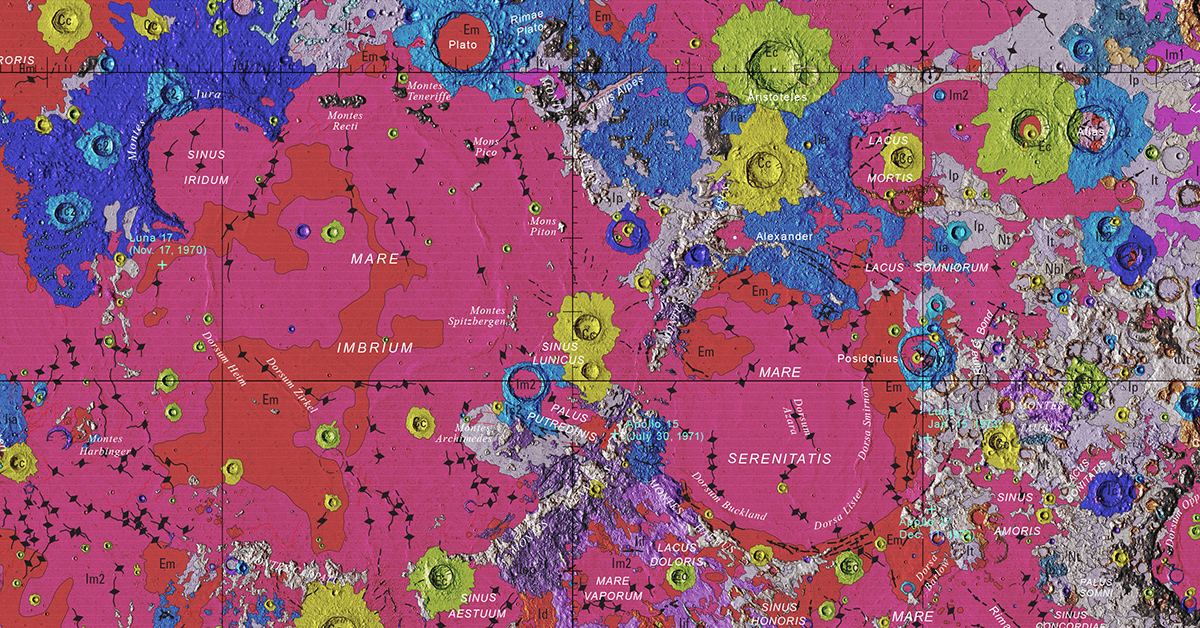
The most visible topographic feature is the giant far side South Pole-Aitken basin, which possesses the lowest elevations of the Moon. The highest elevations are found just to the northeast of this basin. Other large impact basins, such as the Maria Imbrium, Serenitatis, Crisium, Smythii, and Orientale, also have low elevations and elevated rims.
The colors on the map help to define regional features while also highlighting consistent patterns across the lunar surface. Each one of these regions hosts the potential for resources.
Lunar Resources
Only further study will the evolution of the Moon, but it is clear that there are resources earthlings can exploit. Hydrogen, oxygen, silicon, iron, magnesium, calcium, aluminum, manganese, and titanium are some of the metals and minerals on the Moon.
Interestingly, oxygen is the most abundant element on the Moon. It’s a primary component found in rocks, and this oxygen can be converted to a breathable gas with current technology. A more practical question would be how to best power this process.
Lunar soil is the easiest to mine, it can provide protection from radiation and meteoroids as material for construction. Ice can provide water for radiation shielding, life support, oxygen, and rocket propellant feed stock. Compounds from permanently shadowed craters could provide methane, ammonia, carbon dioxide, and carbon monoxide.
This is just the beginning—as more missions are sent to the Moon, there is more to discover.
Space Faring Humans
NASA plans to land astronauts—one female, one male—to the Moon by 2024 as part of the Artemis 3 mission, and after that, about once each year. It’s the beginning of an unfulfilled promise to make humans a space-faring civilization.
The Moon is just the beginning…the skills learned to map Near-Earth Objects will be the foundation for further exploration and discovery of the universe.


Lithium
Ranked: The Top 10 EV Battery Manufacturers in 2023
Asia dominates this ranking of the world’s largest EV battery manufacturers in 2023.


The Top 10 EV Battery Manufacturers in 2023
This was originally posted on our Voronoi app. Download the app for free on iOS or Android and discover incredible data-driven charts from a variety of trusted sources.
Despite efforts from the U.S. and EU to secure local domestic supply, all major EV battery manufacturers remain based in Asia.
In this graphic we rank the top 10 EV battery manufacturers by total battery deployment (measured in megawatt-hours) in 2023. The data is from EV Volumes.
Chinese Dominance
Contemporary Amperex Technology Co. Limited (CATL) has swiftly risen in less than a decade to claim the title of the largest global battery group.
The Chinese company now has a 34% share of the market and supplies batteries to a range of made-in-China vehicles, including the Tesla Model Y, SAIC’s MG4/Mulan, and various Li Auto models.
| Company | Country | 2023 Production (megawatt-hour) | Share of Total Production |
|---|---|---|---|
| CATL | 🇨🇳 China | 242,700 | 34% |
| BYD | 🇨🇳 China | 115,917 | 16% |
| LG Energy Solution | 🇰🇷 Korea | 108,487 | 15% |
| Panasonic | 🇯🇵 Japan | 56,560 | 8% |
| SK On | 🇰🇷 Korea | 40,711 | 6% |
| Samsung SDI | 🇰🇷 Korea | 35,703 | 5% |
| CALB | 🇨🇳 China | 23,493 | 3% |
| Farasis Energy | 🇨🇳 China | 16,527 | 2% |
| Envision AESC | 🇨🇳 China | 8,342 | 1% |
| Sunwoda | 🇨🇳 China | 6,979 | 1% |
| Other | - | 56,040 | 8% |
In 2023, BYD surpassed LG Energy Solution to claim second place. This was driven by demand from its own models and growth in third-party deals, including providing batteries for the made-in-Germany Tesla Model Y, Toyota bZ3, Changan UNI-V, Venucia V-Online, as well as several Haval and FAW models.
The top three battery makers (CATL, BYD, LG) collectively account for two-thirds (66%) of total battery deployment.
Once a leader in the EV battery business, Panasonic now holds the fourth position with an 8% market share, down from 9% last year. With its main client, Tesla, now sourcing batteries from multiple suppliers, the Japanese battery maker seems to be losing its competitive edge in the industry.
Overall, the global EV battery market size is projected to grow from $49 billion in 2022 to $98 billion by 2029, according to Fortune Business Insights.

-

 Debt1 week ago
How Debt-to-GDP Ratios Have Changed Since 2000
-

 Markets2 weeks ago
Ranked: The World’s Top Flight Routes, by Revenue
-

 Countries2 weeks ago
Population Projections: The World’s 6 Largest Countries in 2075
-

 Markets2 weeks ago
The Top 10 States by Real GDP Growth in 2023
-

 Demographics2 weeks ago
The Smallest Gender Wage Gaps in OECD Countries
-

 United States2 weeks ago
Where U.S. Inflation Hit the Hardest in March 2024
-

 Green2 weeks ago
Top Countries By Forest Growth Since 2001
-

 United States2 weeks ago
Ranked: The Largest U.S. Corporations by Number of Employees