Mining
Gold in Nevada: The Real Golden State
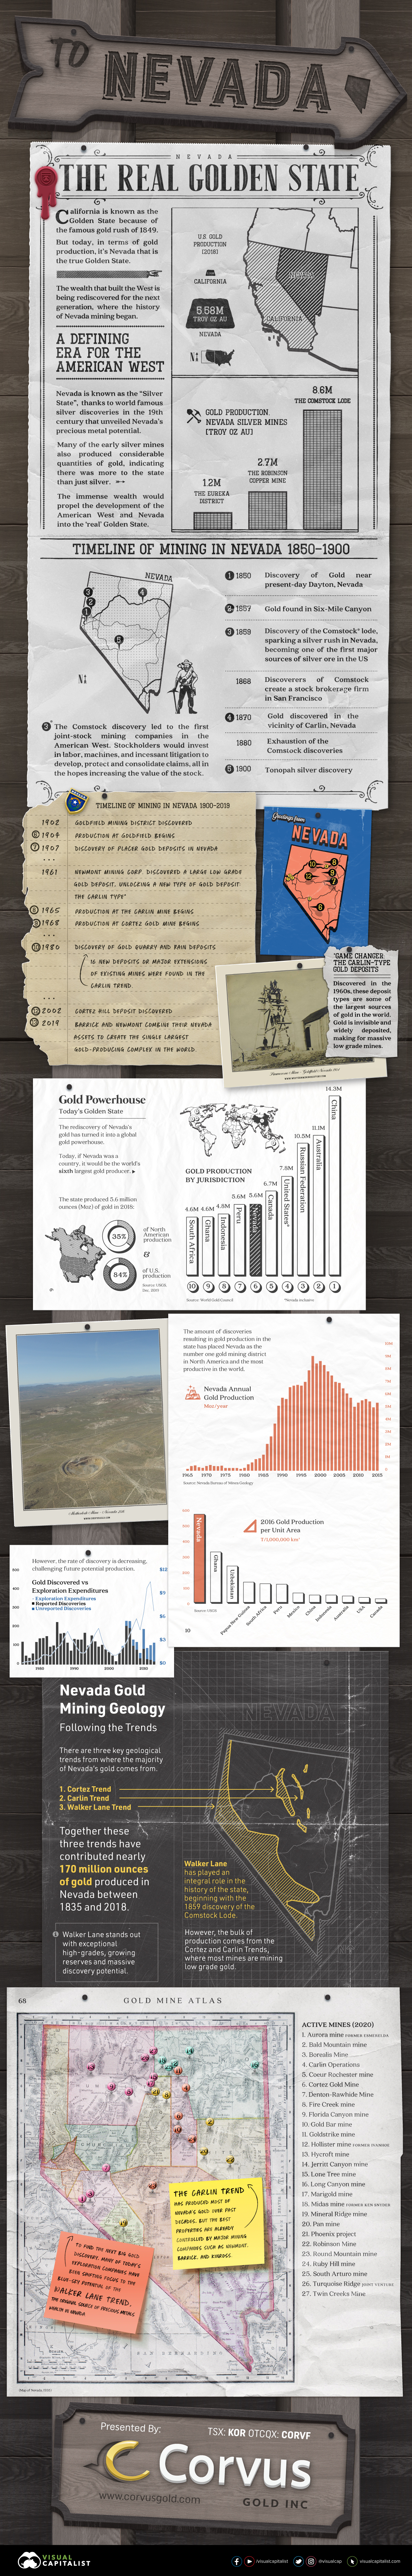
The Real Golden State: Gold Production in Nevada
Thanks to the world famous silver discoveries of the 19th century that unveiled Nevada’s precious metal potential, the state today is known by many as “The Silver State”.
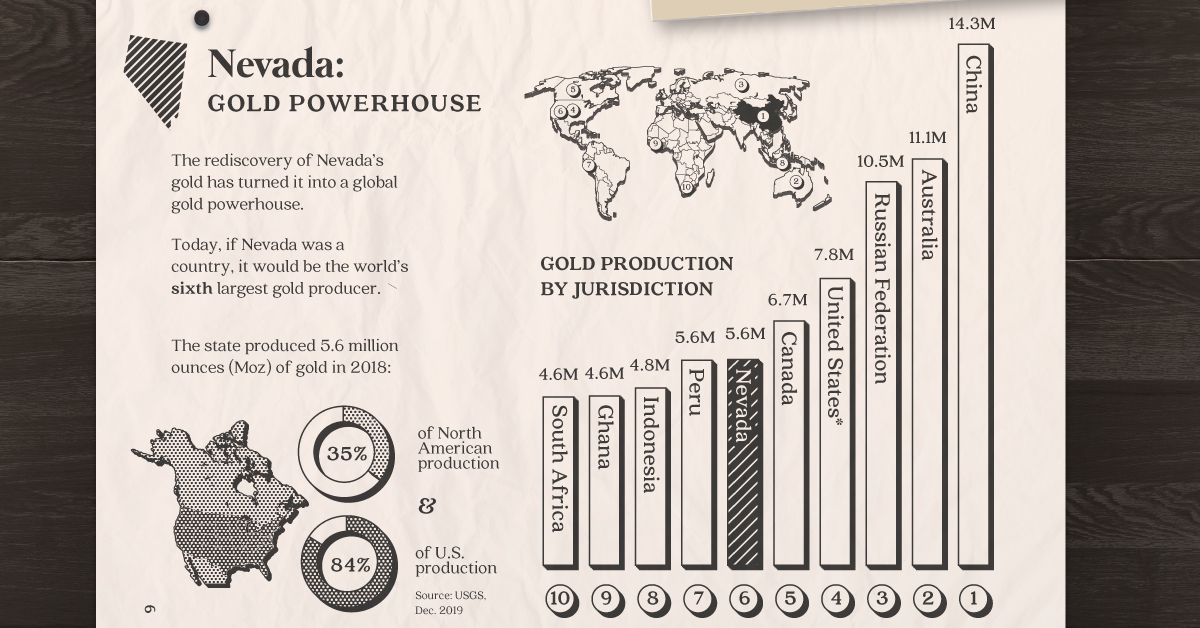
However, it’s possible that nickname may need to be updated. In the last few decades, Nevada has become a prolific gold producer, accounting for 84% of total U.S. gold production each year.
Today’s infographic from Corvus Gold showcases why Nevada may have a better case for deserving California’s nickname of the “Golden State”: we look at the state’s gold production, exploration potential, and even its rich history.
A Defining Era for the American West
The discovery of the Comstock silver lode in 1859 sparked a silver rush of prospectors to Nevada, scrambling to stake their claims. News of the discovery spread quickly throughout the United States, drawing thousands into Nevada for one of the largest rushes since the California Gold Rush in 1849. Mining camps soon thrived and eventually became towns, a catalyst that helped turn the territory into an official state by 1864.
Interestingly, many of the early mines also produced considerable quantities of gold, indicating there was more to the state than just silver.
- The Comstock Lode: 8,600,000 troy ounces (270t) of gold until 1959
- The Eureka district: 1,200,000 troy ounces (37t) of gold
- The Robinson copper mine: 2,700,000 troy ounces (84t) of gold
The Comstock Lode is notable not just for the immense fortunes it generated but also the large role those fortunes had in the growth of Nevada and San Francisco.
In fact, there was so much gold and silver flowing into San Francisco, the U.S. Mint opened a branch in the city to safely store it all. Within the first year of its operation, the San Francisco Mint turned $4 million of gold bullion into coins for circulation.
While California gold rushes became history, Nevada mining was just beginning and would spur the development of modern industry. In 2018, California produced 140,000 troy ounces of gold, just a fraction of the 5.58 million oz coming out of Nevada’s ground.
Nevada Gold Mining Geology: Following the Trends
There are three key geological trends from where the majority of Nevada’s gold comes from.
- Cortez Trend
- Carlin Trend
- Walker Lane Trend
Together these trends contributed nearly 170 million ounces of gold produced in Nevada between 1835 and 2018, making it the United States’ most productive gold jurisdiction, if not the world’s.
The bulk of production comes from the Cortez and Carlin Trends, where mines extract low grade gold from a particular type of mineral deposit, the Carlin Type Gold deposit. It was the discovery and technology used for processing these “invisible” deposits that would turn Nevada into the golden powerhouse of production.
Today, the world’s largest gold mining complex, Nevada Gold Mines, is located on the Carlin Trend. The joint venture between Barrick and Newmont comprises eight mines, along with their infrastructure and processing facilities.
Despite the prolific production of modern mines in the state, more discoveries will be needed to feed this production pipeline—and discoveries are on the decline in Nevada.
Looking to the Future Through the Past: The Walker Lane Trend
The future for gold mining in Nevada may lie in the Walker Lane Trend. This trend is host to some of the most recent gold discoveries, and has attracted the interest of major mining companies looking to conduct exploration, and eventually, production.
Walker Lane stands out with exceptional high-grades, growing reserves, and massive discovery potential. It also played an integral role in the history of the state beginning with the 1859 discovery of the Comstock Lode, and it seems likely to continue doing so in the future.


Lithium
Ranked: The Top 10 EV Battery Manufacturers in 2023
Asia dominates this ranking of the world’s largest EV battery manufacturers in 2023.


The Top 10 EV Battery Manufacturers in 2023
This was originally posted on our Voronoi app. Download the app for free on iOS or Android and discover incredible data-driven charts from a variety of trusted sources.
Despite efforts from the U.S. and EU to secure local domestic supply, all major EV battery manufacturers remain based in Asia.
In this graphic we rank the top 10 EV battery manufacturers by total battery deployment (measured in megawatt-hours) in 2023. The data is from EV Volumes.
Chinese Dominance
Contemporary Amperex Technology Co. Limited (CATL) has swiftly risen in less than a decade to claim the title of the largest global battery group.
The Chinese company now has a 34% share of the market and supplies batteries to a range of made-in-China vehicles, including the Tesla Model Y, SAIC’s MG4/Mulan, and various Li Auto models.
| Company | Country | 2023 Production (megawatt-hour) | Share of Total Production |
|---|---|---|---|
| CATL | 🇨🇳 China | 242,700 | 34% |
| BYD | 🇨🇳 China | 115,917 | 16% |
| LG Energy Solution | 🇰🇷 Korea | 108,487 | 15% |
| Panasonic | 🇯🇵 Japan | 56,560 | 8% |
| SK On | 🇰🇷 Korea | 40,711 | 6% |
| Samsung SDI | 🇰🇷 Korea | 35,703 | 5% |
| CALB | 🇨🇳 China | 23,493 | 3% |
| Farasis Energy | 🇨🇳 China | 16,527 | 2% |
| Envision AESC | 🇨🇳 China | 8,342 | 1% |
| Sunwoda | 🇨🇳 China | 6,979 | 1% |
| Other | - | 56,040 | 8% |
In 2023, BYD surpassed LG Energy Solution to claim second place. This was driven by demand from its own models and growth in third-party deals, including providing batteries for the made-in-Germany Tesla Model Y, Toyota bZ3, Changan UNI-V, Venucia V-Online, as well as several Haval and FAW models.
The top three battery makers (CATL, BYD, LG) collectively account for two-thirds (66%) of total battery deployment.
Once a leader in the EV battery business, Panasonic now holds the fourth position with an 8% market share, down from 9% last year. With its main client, Tesla, now sourcing batteries from multiple suppliers, the Japanese battery maker seems to be losing its competitive edge in the industry.
Overall, the global EV battery market size is projected to grow from $49 billion in 2022 to $98 billion by 2029, according to Fortune Business Insights.

-

 Debt1 week ago
How Debt-to-GDP Ratios Have Changed Since 2000
-

 Markets2 weeks ago
Ranked: The World’s Top Flight Routes, by Revenue
-

 Countries2 weeks ago
Population Projections: The World’s 6 Largest Countries in 2075
-

 Markets2 weeks ago
The Top 10 States by Real GDP Growth in 2023
-

 Demographics2 weeks ago
The Smallest Gender Wage Gaps in OECD Countries
-

 United States2 weeks ago
Where U.S. Inflation Hit the Hardest in March 2024
-

 Green2 weeks ago
Top Countries By Forest Growth Since 2001
-

 United States2 weeks ago
Ranked: The Largest U.S. Corporations by Number of Employees