Mining
Golden Bulls: Visualizing the Price of Gold from 1915-2020
Golden Bulls: Visualizing the Price of Gold from 1915-2020
Some people view gold as a relic, a thing of kings, pirates, and myth. It does not produce income, sits in vaults, and adorns the necks and wrists of the wealthy.
But this too is just myth.
In fact, as a financial asset, gold’s value has shone over time with periods of exceptional performance, one of which may be occurring now.
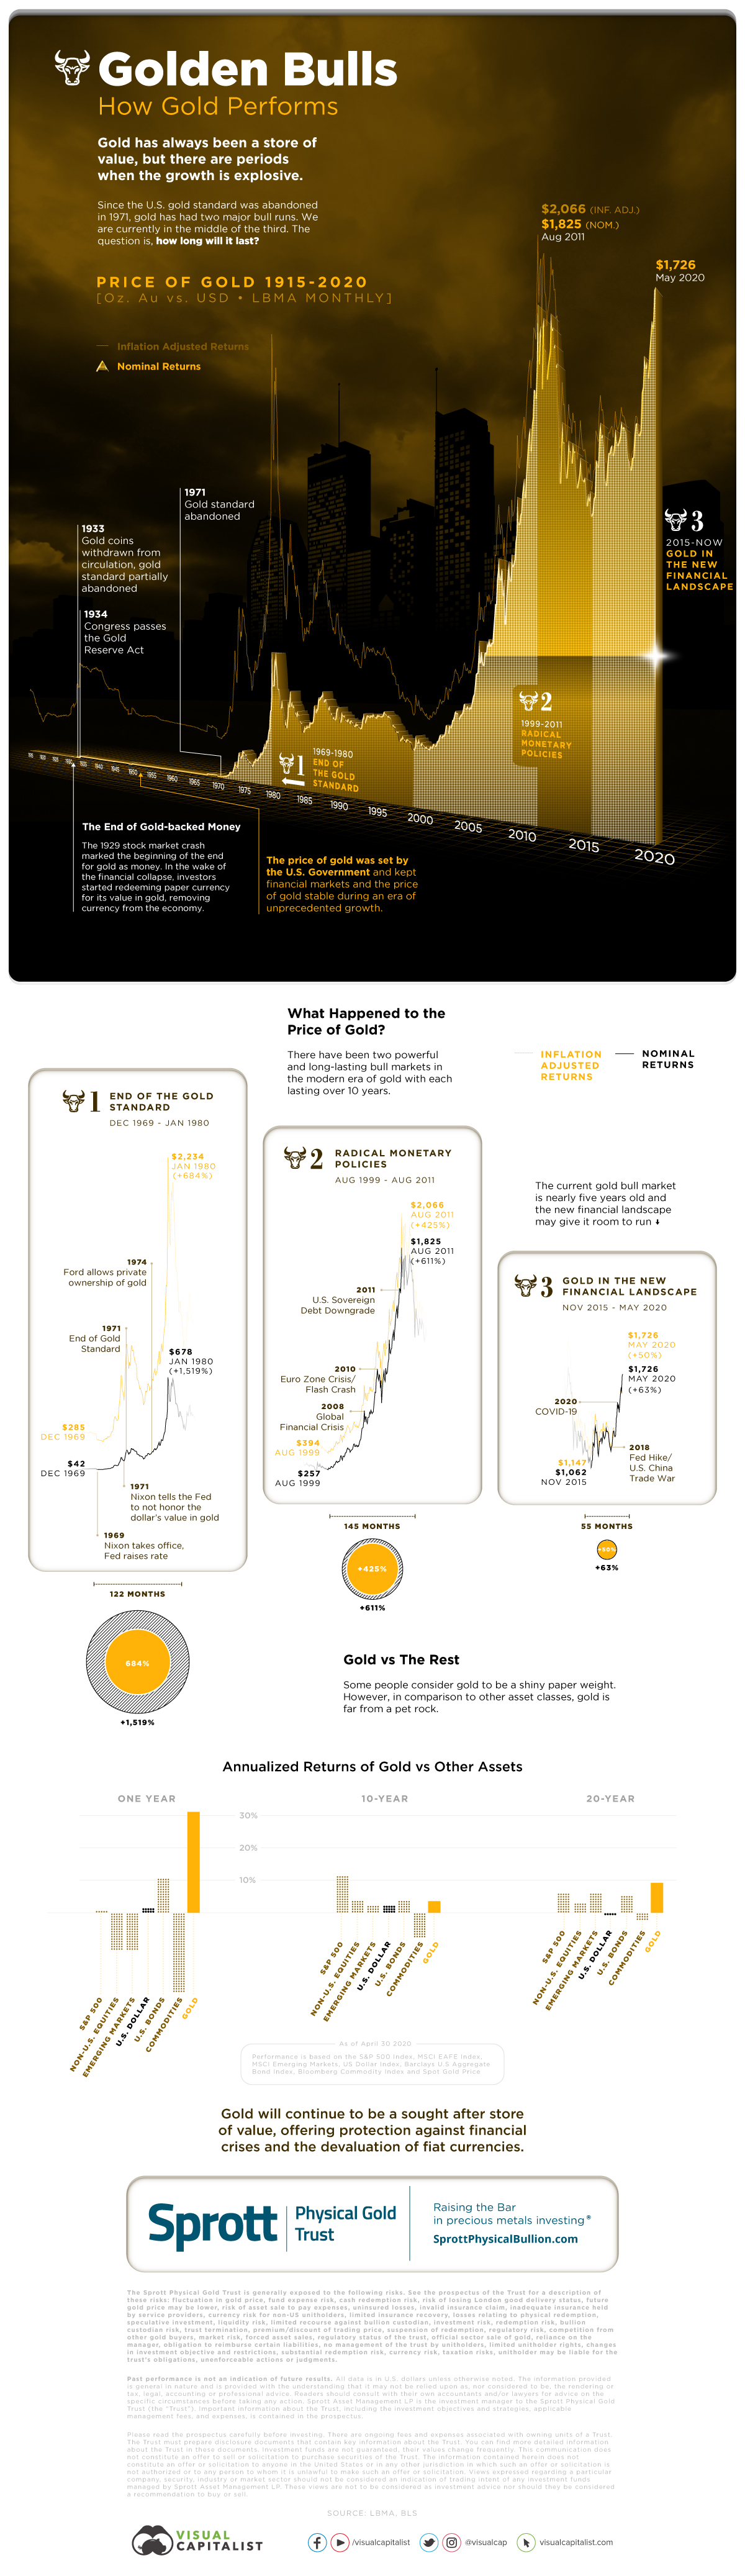
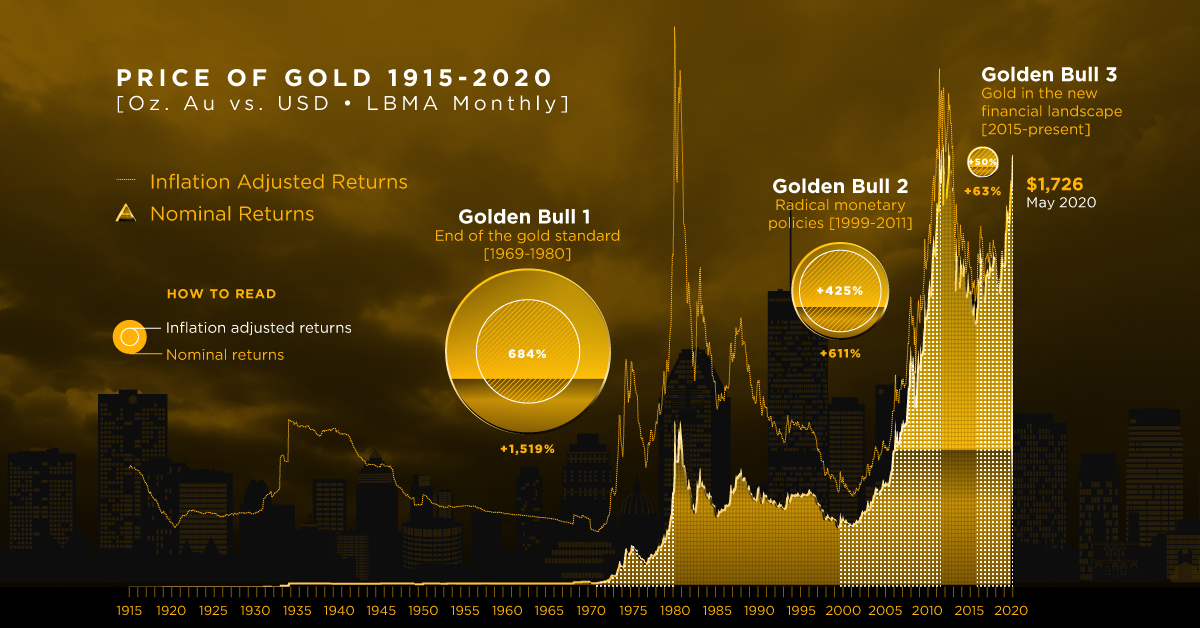
Today’s infographic comes to us from Sprott Physical Gold Trust and outlines the history of the price of gold from 1915 to 2020 and three bull markets or “Golden bulls” since 1969, using monthly data from the London Bullion Market Association.
But first a little history…
The Gold Standard
*All figures are in USD
During the early days of the American Republic, the U.S. used the British gold standard to set the price of its currency. In 1791, it established the price of gold at $19.75 per ounce but also allowed redemption in silver. In 1834, it raised the price of gold to $20.67 per ounce. The price of gold would retain a nominal value through depressions, civil wars, and wars.
However, $20 today is not the same as $20 in the past. The U.S. dollar may have been convertible at a set price, but the amount of goods that it could buy varies year to year based on inflation. So for example from 1934 to 1938, one ounce of gold would cost $34, but $34 today would purchase a small fraction of an ounce of gold.
While the price of gold may appear cheap in the past, adjusted for inflation it is not as low as you would think. Governments would set the price of its currency against an asset to ensure the stability of prices, however if there would be too many claims against the underlying asset, that asset would run out and the currency would become worthless.
This threat would force the hands of governments to change the standards, as currency became more common and gold reserves more scarce.
An Era of Government Intervention
In the wake of the 1929 stock market crash, investors started redeeming U.S. dollars for its equivalent value in gold, removing currency from the economy. In order to stem the flow of funds into gold and the depletion of government gold reserves, in 1933, President Franklin D. Roosevelt limited the private ownership of gold to discourage hoarding and encourage investing. In 1934, Congress passed the Gold Reserve Act which prohibited the private ownership of gold and nominally raised the price of gold to $35 per ounce.
In 1944, the victorious Allied powers negotiated the Bretton Woods Agreement, making the U.S. dollar the official global reserve currency. The United States ensured an ounce of gold would be worth $35 in its currency—at least until the onset of a stagnant economy in the early Seventies led to the official end of any real gold standard.
Golden Bull #1: December 1969 – January 1980
In 1969, the U.S. gold standard had risen to $42 per ounce in nominal terms, however a period of economic volatility would challenge and change U.S. monetary policy.
On August 15, 1971, President Richard Nixon mandated the Federal Reserve to stop honoring the U.S. dollar’s value in gold at a fixed value, abandoning the gold standard. In 1974, President Gerald Ford would once again allow the private ownership of gold bullion. Energy crises, soaring inflation, and high unemployment stagnated the economy.
By January 1980, the price of gold reached $2,234 per ounce in today’s dollars amidst an environment of double-digit inflation. Federal Reserve chairman Paul Volcker fought this inflation with double-digit interest rates which in turn slowed the economy, causing a recession.
The interest-rate-induced recession would herald in a new global economic boom that defined the Eighties and Nineties. The price of gold dropped to $753.96 per ounce by June 1985, as the economy improved.
From December 1969 to January 1980, gold rose from $285 to $2,234 per ounce, an increase of 684% over 122 months, in inflation-adjusted terms.
Golden Bull #2: August 1999 – August 2011
Expanding household incomes and ever declining interest rates under Federal Reserve chairman Greenspan pushed gold further down to a low of $377.44 per ounce by the end of April 2001.
Loose monetary policy and a reduced tax on capital gains spurred speculative investments into the new internet economy through a growing retail brokerage market and the emergence of venture capital. The tech bubble would eventually pop as these companies were unable to build sustainable businesses and investor money dried up.
Over the year of 2000, investors rushed to exit their speculative tech investments resulting in several market crashes. Then in September 2001, 9/11 happened, marking the beginning of a new era. Gold steadily rose during this period.
In 2008, the Global Financial Crisis shook financial markets and left a recession. Policy makers and central bankers embarked on a controversial policy of quantitative easing to support financial markets. The price of one ounce of gold reached new highs by the end of August 2011, as worries on debt levels mounted for the U.S. and other countries.
From August 1999 to August 2011, gold rose from $394 to $2,066 per ounce, an increase of 425% over 145 months, in inflation-adjusted terms.
Golden Bull #3?: November 2015 – May 2020
In the aftermath of the GFC, the Federal Reserve stoked an economic recovery with cheap money, seeing gold track to a low of $1,050 per ounce by December 2015. It was not until the election of a peculiar American president in 2016 that gold would rise again.
Pressure to increase interest rates, an aging debt-fueled economic recovery, a trade war with China, and the recent COVID-19 crisis has once again provoked economic uncertainty and a renewed interest in gold. With interest rates already at historic lows and quantitative easing as standard operating procedure, global economies are entering unprecedented territory.
There is still little insight into the direction of the economy but since November 2015 to May 2020, the price of gold has risen from $1,146 to $1,726 per ounce, 55% over 55 months.
Gold Going Forward
In an era of tech startups, ETFs, and algorithmic trading, many people consider gold to be a shiny paperweight—however, its performance over time against other assets shows it is far from this.
In 1915, an ounce of gold was worth $488.66 per ounce in today’s dollars and as of May 15, 2020, $1,751 per ounce. Gold has proven its value over time as companies, countries, and governments come and go.
“Golden Bulls” are no periods for idle idol worship. Gold will always be gold, in myth and in fact.


Lithium
Ranked: The Top 10 EV Battery Manufacturers in 2023
Asia dominates this ranking of the world’s largest EV battery manufacturers in 2023.


The Top 10 EV Battery Manufacturers in 2023
This was originally posted on our Voronoi app. Download the app for free on iOS or Android and discover incredible data-driven charts from a variety of trusted sources.
Despite efforts from the U.S. and EU to secure local domestic supply, all major EV battery manufacturers remain based in Asia.
In this graphic we rank the top 10 EV battery manufacturers by total battery deployment (measured in megawatt-hours) in 2023. The data is from EV Volumes.
Chinese Dominance
Contemporary Amperex Technology Co. Limited (CATL) has swiftly risen in less than a decade to claim the title of the largest global battery group.
The Chinese company now has a 34% share of the market and supplies batteries to a range of made-in-China vehicles, including the Tesla Model Y, SAIC’s MG4/Mulan, and various Li Auto models.
| Company | Country | 2023 Production (megawatt-hour) | Share of Total Production |
|---|---|---|---|
| CATL | 🇨🇳 China | 242,700 | 34% |
| BYD | 🇨🇳 China | 115,917 | 16% |
| LG Energy Solution | 🇰🇷 Korea | 108,487 | 15% |
| Panasonic | 🇯🇵 Japan | 56,560 | 8% |
| SK On | 🇰🇷 Korea | 40,711 | 6% |
| Samsung SDI | 🇰🇷 Korea | 35,703 | 5% |
| CALB | 🇨🇳 China | 23,493 | 3% |
| Farasis Energy | 🇨🇳 China | 16,527 | 2% |
| Envision AESC | 🇨🇳 China | 8,342 | 1% |
| Sunwoda | 🇨🇳 China | 6,979 | 1% |
| Other | - | 56,040 | 8% |
In 2023, BYD surpassed LG Energy Solution to claim second place. This was driven by demand from its own models and growth in third-party deals, including providing batteries for the made-in-Germany Tesla Model Y, Toyota bZ3, Changan UNI-V, Venucia V-Online, as well as several Haval and FAW models.
The top three battery makers (CATL, BYD, LG) collectively account for two-thirds (66%) of total battery deployment.
Once a leader in the EV battery business, Panasonic now holds the fourth position with an 8% market share, down from 9% last year. With its main client, Tesla, now sourcing batteries from multiple suppliers, the Japanese battery maker seems to be losing its competitive edge in the industry.
Overall, the global EV battery market size is projected to grow from $49 billion in 2022 to $98 billion by 2029, according to Fortune Business Insights.

-

 Debt1 week ago
How Debt-to-GDP Ratios Have Changed Since 2000
-

 Markets2 weeks ago
Ranked: The World’s Top Flight Routes, by Revenue
-

 Demographics2 weeks ago
Population Projections: The World’s 6 Largest Countries in 2075
-

 Markets2 weeks ago
The Top 10 States by Real GDP Growth in 2023
-

 Demographics2 weeks ago
The Smallest Gender Wage Gaps in OECD Countries
-

 United States2 weeks ago
Where U.S. Inflation Hit the Hardest in March 2024
-

 Green2 weeks ago
Top Countries By Forest Growth Since 2001
-

 United States2 weeks ago
Ranked: The Largest U.S. Corporations by Number of Employees