Markets
Video: How the U.S. Dollar Spread Across the World
Video: How the U.S. Dollar Spread Across the World
The U.S. dollar is the world’s dominant reserve currency, making up about 64% of all official foreign exchange reserves.
The euro is second on the list. The euro had shown decent promise as a reserve currency up until 2009, when it peaked at 28% of global reserves. However, between the European Debt Crisis and years of anemic growth in major European countries, the currency has declined to 20% of official global reserves today.
Other currencies held as foreign reserves include British pounds (5%), Japanese yen (4%), Canadian dollars (2%), and Australian dollars (2%). Swiss francs and other currencies make up the remaining 3%.
The Chinese yuan also recently won IMF approval to make up part of its Special Drawing Rights (SDR) basket. More and more trade is in Chinese currency, and the country’s bond markets are beginning to grow and internationalize.
The yuan is not a significant player yet, but in the future it may be.
The Rise of the Dollar
History has shown that every 100 years or so, the world’s de facto reserve currency has been replaced.
The last time this happened was after World War II, when the Bretton Woods system came into effect. Under this system, the U.S. dollar was established as the global anchor currency, linked to gold at a fixed rate. The combination of post-war growth in the U.S. economy along with the official link between dollars and gold provided the international monetary system with a degree of certainty that had been missing for decades.
In 1971, Nixon severed the link between the U.S. dollar and gold, but continued U.S. economic and financial strength would keep the dollar prominent on the international monetary stage for decades to come.
What Does the Future Hold?
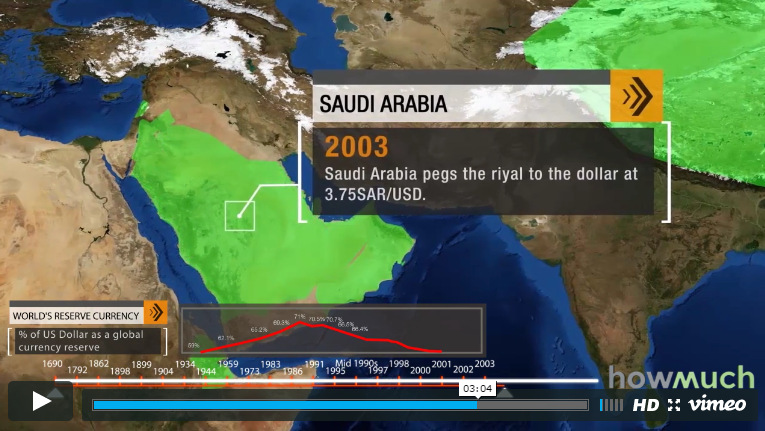
The video in this post, created by the team at HowMuch.net shows the evolution in acceptance of the greenback. At first, it was U.S. overseas territories such as Guam and the U.S. Virgin Islands that would adopt the dollar. Later in the 20th century, major nations from China to Argentina would attempt to peg their currencies to the dollar for much-needed stability.
Will this dollar hegemony continue well into the future?
As HowMuch.net notes in its post, it is the size, stability, and liquidity of the country’s financial markets that are the major underlying factors to determine the strength of a reserve currency.
While China is now the largest economy in the world in terms of purchasing power, the financial markets of the United States still reign supreme. For example, U.S. stock markets still make up 52% of the total market capitalization of global equity markets. China’s markets are puny in comparison at around 2%.
There are signs of a shift in momentum, however.
U.S. Treasuries have less liquidity and China has been dumping them on the market. The yuan is officially part of the SDR basket in October 2016, and China could see an inflow of up to $3 trillion in renminbi assets as a result. The yuan has also now passed the yen in terms of cross-border trade volume.


Economy
Economic Growth Forecasts for G7 and BRICS Countries in 2024
The IMF has released its economic growth forecasts for 2024. How do the G7 and BRICS countries compare?


G7 & BRICS Real GDP Growth Forecasts for 2024
The International Monetary Fund’s (IMF) has released its real gross domestic product (GDP) growth forecasts for 2024, and while global growth is projected to stay steady at 3.2%, various major nations are seeing declining forecasts.
This chart visualizes the 2024 real GDP growth forecasts using data from the IMF’s 2024 World Economic Outlook for G7 and BRICS member nations along with Saudi Arabia, which is still considering an invitation to join the bloc.
Get the Key Insights of the IMF’s World Economic Outlook
Want a visual breakdown of the insights from the IMF’s 2024 World Economic Outlook report?
This visual is part of a special dispatch of the key takeaways exclusively for VC+ members.
Get the full dispatch of charts by signing up to VC+.
Mixed Economic Growth Prospects for Major Nations in 2024
Economic growth projections by the IMF for major nations are mixed, with the majority of G7 and BRICS countries forecasted to have slower growth in 2024 compared to 2023.
Only three BRICS-invited or member countries, Saudi Arabia, the UAE, and South Africa, have higher projected real GDP growth rates in 2024 than last year.
| Group | Country | Real GDP Growth (2023) | Real GDP Growth (2024P) |
|---|---|---|---|
| G7 | 🇺🇸 U.S. | 2.5% | 2.7% |
| G7 | 🇨🇦 Canada | 1.1% | 1.2% |
| G7 | 🇯🇵 Japan | 1.9% | 0.9% |
| G7 | 🇫🇷 France | 0.9% | 0.7% |
| G7 | 🇮🇹 Italy | 0.9% | 0.7% |
| G7 | 🇬🇧 UK | 0.1% | 0.5% |
| G7 | 🇩🇪 Germany | -0.3% | 0.2% |
| BRICS | 🇮🇳 India | 7.8% | 6.8% |
| BRICS | 🇨🇳 China | 5.2% | 4.6% |
| BRICS | 🇦🇪 UAE | 3.4% | 3.5% |
| BRICS | 🇮🇷 Iran | 4.7% | 3.3% |
| BRICS | 🇷🇺 Russia | 3.6% | 3.2% |
| BRICS | 🇪🇬 Egypt | 3.8% | 3.0% |
| BRICS-invited | 🇸🇦 Saudi Arabia | -0.8% | 2.6% |
| BRICS | 🇧🇷 Brazil | 2.9% | 2.2% |
| BRICS | 🇿🇦 South Africa | 0.6% | 0.9% |
| BRICS | 🇪🇹 Ethiopia | 7.2% | 6.2% |
| 🌍 World | 3.2% | 3.2% |
China and India are forecasted to maintain relatively high growth rates in 2024 at 4.6% and 6.8% respectively, but compared to the previous year, China is growing 0.6 percentage points slower while India is an entire percentage point slower.
On the other hand, four G7 nations are set to grow faster than last year, which includes Germany making its comeback from its negative real GDP growth of -0.3% in 2023.
Faster Growth for BRICS than G7 Nations
Despite mostly lower growth forecasts in 2024 compared to 2023, BRICS nations still have a significantly higher average growth forecast at 3.6% compared to the G7 average of 1%.
While the G7 countries’ combined GDP is around $15 trillion greater than the BRICS nations, with continued higher growth rates and the potential to add more members, BRICS looks likely to overtake the G7 in economic size within two decades.
BRICS Expansion Stutters Before October 2024 Summit
BRICS’ recent expansion has stuttered slightly, as Argentina’s newly-elected president Javier Milei declined its invitation and Saudi Arabia clarified that the country is still considering its invitation and has not joined BRICS yet.
Even with these initial growing pains, South Africa’s Foreign Minister Naledi Pandor told reporters in February that 34 different countries have submitted applications to join the growing BRICS bloc.
Any changes to the group are likely to be announced leading up to or at the 2024 BRICS summit which takes place October 22-24 in Kazan, Russia.
Get the Full Analysis of the IMF’s Outlook on VC+
This visual is part of an exclusive special dispatch for VC+ members which breaks down the key takeaways from the IMF’s 2024 World Economic Outlook.
For the full set of charts and analysis, sign up for VC+.

-

 Markets1 week ago
U.S. Debt Interest Payments Reach $1 Trillion
-

 Markets2 weeks ago
Ranked: The Most Valuable Housing Markets in America
-

 Money2 weeks ago
Which States Have the Highest Minimum Wage in America?
-

 AI2 weeks ago
Ranked: Semiconductor Companies by Industry Revenue Share
-

 Markets2 weeks ago
Ranked: The World’s Top Flight Routes, by Revenue
-

 Countries2 weeks ago
Population Projections: The World’s 6 Largest Countries in 2075
-

 Markets2 weeks ago
The Top 10 States by Real GDP Growth in 2023
-

 Money2 weeks ago
The Smallest Gender Wage Gaps in OECD Countries